Monitoring Aggregate Usage
The Aggregates page displays all aggregate instances that have been defined for your deployed models, as well as your aggregate build history. You can view what aggregates have been created, when they were last built, and how often they have been queried.
To access the Aggregates page, open the left-side navigation and click Aggregates.
Definitions tab
The Definitions tab displays all aggregate definitions in your system.

The table contains the following information for each definition:
-
The name of the model and catalog the aggregate is defined on.
-
The aggregate type; for example, manual or hinted.
-
The aggregate's status:
- Active: The definition is complete and available for queries.
- Building: The definition is currently being created.
- Canceled: The definition was canceled by user request.
- Deleted: The definition was deleted.
- Failed: The definition failed.
- Inactive: The definition is no longer used.
- Pending: The definition is pending.
- Queued: The definition is in the build queue.
- Staged: The definition is complete, but is waiting for a remaining batch to complete before being activated.
- Unavailable: The definition cannot be accessed.
-
The aggregate definition's utilization, or how many times overall queries have accessed it since its inception.
-
When the last build started and how long it lasted.
-
The specific attributes and measures included in the aggregate definition.
You can use the fields at the top of the tab to filter the table; for example, you can filter by aggregate type or when an aggregate was last accessed.
Aggregate details panel
You can click on an aggregate definition in the table to open the aggregate details panel, which displays additional information about it.
The Instances section of the panel displays all instances of the aggregate, including its status, when it was last built, how long the build took, and how many rows it contains.
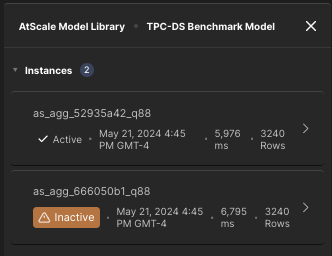
From here, you can click on an instance to open the instance details panel, which contains more information about that particular instance.
The Metadata section of the aggregate details panel contains general information about the aggregate definition:
-
Aggregate Name: The name of the aggregate. This is only applicable if the aggregate is a UDA.
-
Aggregate ID: The unique ID associated with the aggregate.
-
Created Date: When the aggregate was created.
-
Definition Status: Whether the aggregate is usable or unusable.
-
Data Warehouse: The data warehouse in which the aggregate definition was built.
-
Last Build Started: When the process that built the most recent definition began. If the aggregate instance is currently building, this field displays the build start time.
-
Last Build Ended: When the process that built the most recent definition ended.
-
Last Accessed: When any query last accessed the aggregate definition.
-
Utilizations (Cumulative): The total number of queries that have used the aggregate since it was created.
-
Utilizations (Recent): The total number of queries that have used the aggregate over the past X number of days.
The number of days corresponds to the value of the Window Size parameter; for details, see Aggregate Settings.
Consider that the Utilizations value may not be current, since the job that updates the recent usage counts runs periodically (three times per day). The value displayed here is not calculated on demand, and it is not recalculated if you refresh the browser.
-
Query Saved Time: Amount of time saved due to aggregation.
-
Incremental: Whether the aggregate will be incrementally updated.
-
Attributes and Metrics present in the aggregate definition.
Instance details panel
The instance details panel contains detailed information about a particular aggregate instance, including its SQL query. You open the instance details panel by clicking on a particular instance in the Instances section of the aggregate details panel.
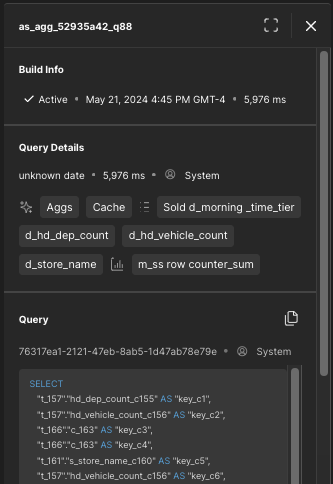
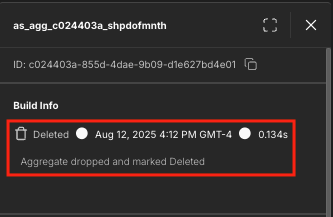
For instances that are not active (e.g., failed, inactive, deleted), the panel also displays information about how it became inactive.
Build History tab
The Build History tab of the Aggregates page displays aggregate builds that have run in your system.

The table contains the following information for each build:
- The name of the catalog and model for which aggregates were built.
- The build status.
- The build start time and duration.
You can filter the builds using the fields above the table.
Build details panel
You can click on a specific build in the table to open the build details panel.
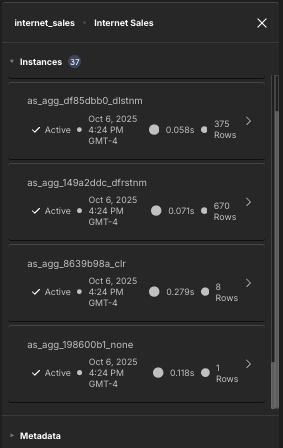
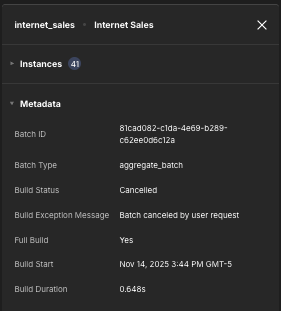
The Instances section of the panel displays all aggregate instances built in that particular build. You can click on each instance to open the instance build details panel, which displays additional information about that particular aggregate instance.
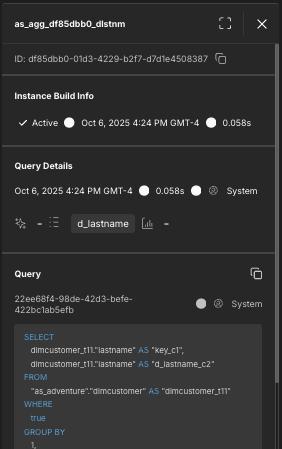
The Metadata section of the build details panel displays information about the build itself, including its batch ID, batch type, and status. For builds that failed, the panel also lists the reason the build failed.
