Non-Additive Metrics
Non-additive metrics are those that cannot be summed across any dimensional groupings using basic addition, since this would usually produce an inaccurate result. The most common example of a non-additive metric is a distinct count of an attribute value.
The AtScale engine does not create aggregates for non-additive metrics. You can, however, manually create a user-defined aggregate for a non-additive metric if necessary.
The aggregate calculations listed below produce non-additive metrics in AtScale.
Distinct sum (exact)
Distinct sum metrics provide the sum of distinct values.
To avoid performance issues, AtScale recommends only using distinct sum metrics against integers. In particular, you should avoid using them against floating point numbers.
By default, AtScale does not create aggregates for this type of metric. You can however, enable them by enabling the aggregates.create.allowDistinctSumMeasures.enabled setting.
You can also use the following settings:
aggregates.systemGenerated.withDistinctSumMeasure.retentionPercentagecontrols the size of the pool dedicated to distinct sum aggregates to prevent them from dominating the aggregate retention limit.aggregates.withDistinctSums.widening.enabledallows widening of distinct sum aggregates with other metrics, including distinct sums.
For more information on these settings, see Aggregate Settings. For more information on configuring settings in AtScale, see Configuring Global Settings and Configuring Model Settings.
Distinct count (exact)
For example, suppose you wanted to know how many distinct customers purchased a particular product. If a single customer buys a product more than once, an additive count will count the customer twice and give incorrect results. For example, there were a total of six sales for the product, but those sales came from only five distinct customers. In order to get the correct results, you need to look at the individual customers who bought the product, and take out the duplicates.
By default, the AtScale engine does not create aggregates for this type of metric because the engine would have to compute and store every exact combination of dimension members to ensure accuracy, which is not scalable. For example, to count the number of customer purchases by gender (which has two distinct values: Male and Female) and by state (which has potentially 50 distinct values: AZ, CA, TX, and so on), the intersection of those two dimensions alone would require 100 pre-computed values for each non-additive metric.
You can however, enable aggregates for distinct count metrics by enabling the aggregates.create.allowExactDistinctCountMeasures.enabled setting. You can also use the following settings:
aggregates.systemGenerated.withDistinctCountMeasure.retentionPercentagecontrols the size of the pool dedicated to distinct count aggregates to prevent them from dominating the aggregate retention limit.aggregates.withDistinctCounts.widening.enabledallows widening of distinct count aggregates with other metrics, including distinct counts.aggregates.create.withDistinctCounts.queryLevel.enabledis a model setting that allows distinct count aggregates to be created at the hierarchy level specified in the query. This setting is enabled by default.
For more information on these settings, see Aggregate Settings (global level) and Aggregate Settings (model level). For more information on configuring settings in AtScale, see Configuring Global Settings and Configuring Model Settings.
Count if
Count If metrics return the number of records that satisfy a condition. If no records satisfy the condition, the metric returns NULL.
Count If metrics require a Boolean column. You may need to create a calculated column if you cannot satisfy this requirement.
Percentile
Before trying to create a percentile metric, make sure your data warehouse supports them. Verify that your data warehouse platform has NTILE checked in AtScale Supported Tools and Platforms.
With percentile metrics, analysts using client BI tools can query data sources to show data values at percentile ranks, insulate their analyses from outliers, and find the percentile rank for specific records. You can create percentile metrics on numeric columns that use the float or integer data types.
Percentile metrics can estimate values at specific quantiles:
- Median
- Quartile
- Decile
- Custom
AtScale estimates the values through an algorithm that requires memory and CPU resources in your data warehouse. The higher the quality of the estimate you want AtScale to calculate, the more memory is required. When you create a percentile metric, you can set a level of quality from 1 - 50,000. AtScale provides predefined levels for estimate quality, which break down as follows:
- Low: 50
- Medium: 200
- High: 1000
You can also specify a custom quality, if needed.
When deciding which level of quality to set, consider the following:
-
Dimensionality of the queries that will use your percentile metrics. Queries that reference a large number of dimensions require more memory on the nodes of your data warehouse than queries that reference a smaller number of dimensions. Of course, "large" and "small" are relative to your system resources and the number of dimensions in your data models.
- If the bulk of the queries that will use the metric will reference a large number of dimensions, use either a Low (50) or Medium (200) quality estimate. Lower quality estimates require less memory in your data warehouse than high quality ones, at the cost of less accurate estimates for percentile values.
- If the bulk of the queries that will use the metric will reference a smaller number of dimensions, use either a Medium (200) or High (1000) quality estimate. A high estimate provides more accurate percentile estimates, at the cost of more memory in your data warehouse.
-
Amount of memory on each node of your data warehouse. The task of percentile estimation during query processing is divided across your nodes. High quality estimates require more memory, whereas low quality estimates require relatively less memory. Data warehouses that have a smaller number of nodes must have relatively more memory per node than data warehouses that have a larger number of nodes, as more processing must be done on each node.
-
Higher qualities. As previously mentioned, the level of quality can be set using an integer number between 1 - 50,000. AtScale's predefined levels of Low, Medium, and High correspond to values of 50, 200, and 1000, respectively. For large data sets (billions of rows), using one of these predefined levels may occasionally lead to incorrect results. In such situations, using the Custom option to set a higher quality value (for example, 15000) can help improve the results.
Ultimately, you will need to run tests based on the criteria above to decide which quality setting to use.
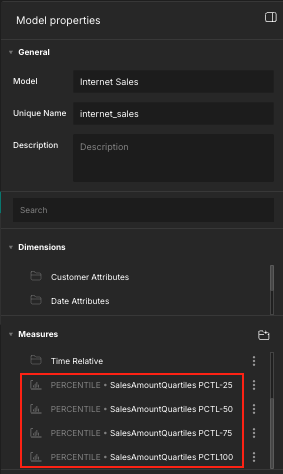
After you create a percentile metric, it appears in the Model properties panel with your other metrics. This gives you an idea of how it will appear in BI tools.
Figure 1. A percentile metric ranked by quartiles in the Model properties panel.
For more information on creating percentile metrics, see Add Additive or Non-Additive Metrics.
Percentile example
Suppose you have an aggregate with the following characteristics:
- It contains one or more percentile metrics.
- It contains or joins to the lowest level of a hierarchy in a dimension.
Next, suppose a query is issued for a percentile ranking based on a higher level in the dimension's hierarchy.
If the aggregates.create.buildFromExisting global setting is set to true (its default value), then the engine can satisfy the query by creating a smaller aggregate based on the current aggregate, rather than by scanning the fact table. The engine can do this whether the first aggregate is system- or user-defined.
For example, suppose the engine created an aggregate in response to queries for the median net sales price for an item in each state. If a query subsequently asks for the median net sales per country, the engine can create a new aggregate by rolling up the data in the existing aggregate. The alternative to creating this second aggregate would be for the engine to scan the fact table.