Degenerate Dimensions
A degenerate dimension is based on one or more columns within a fact dataset.
This type of dimension can also be based on one or more columns that are common to two or more fact datasets (in which case, the dimension is a shared degenerate dimension). The dimension columns are not normalized into a separate dataset.
When you have your dimensional data and fact data in the same dataset, you can still model logical dimensions in AtScale. For example, in the image below, the Color dimension, which is a degenerate dimension, is embedded in the factinternetsales fact dataset.
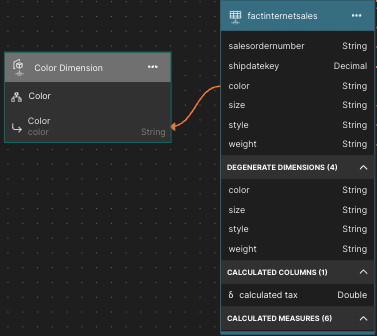
A degenerate dimension can be modeled on one or several columns of the fact dataset. In this case, the modeling workflow is similar to that of a normal dimension, except that the table or view backing the dimension is the fact dataset itself.
Logical dimensions that are degenerate dimensions are represented with a gray header on the Canvas.
Shared degenerate dimensions
Suppose you have a model with two fact datasets: factinternetsales_1 and factinternetsales_2. You want to be able to view the data for both fact datasets by a shared set of dimensions: a Date dimension, a Product dimension, and a Currency_Key dimension. The data for the first two dimensions are in separate datasets. The data for the Currency_Key dimension are in the currencykey column of each fact dataset. Currency_Key is therefore a degenerate dimension. To use it with both fact datasets, you'll need to make it a shared degenerate dimension.
The two fact datasets have the same columns. The main difference is that they have different values for the currencykey column.
| Table | Values in the currencykey column |
|---|---|
| factinternetsales_1 | 6, 19, 29 |
| factinternetsales_2 | 39, 98, 100 |
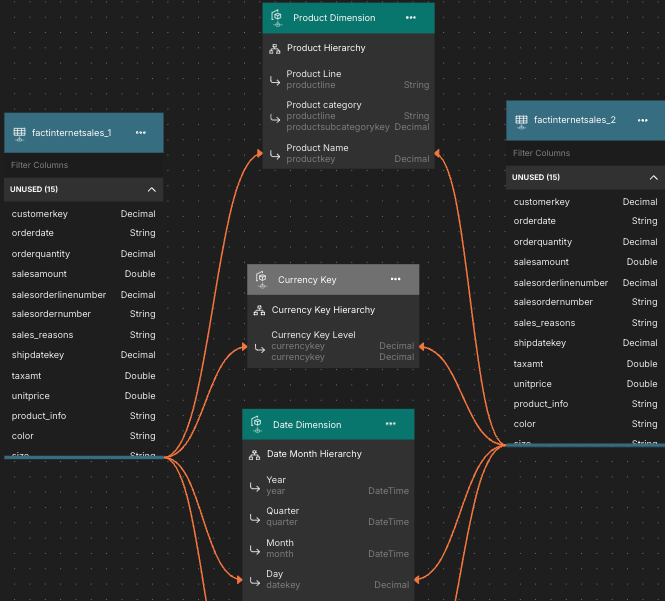
First, you take care of the regular dimensions. You include the Date dimension and you join orderdatekey in each fact dataset to datekey in the Date Month hierarchy. You next include the Product dimension and you join productkey in each fact dataset to productkey in the dimension. Your model now looks like this:
Figure 1. Relationships from the two fact datasets to the Date and Product dimensions
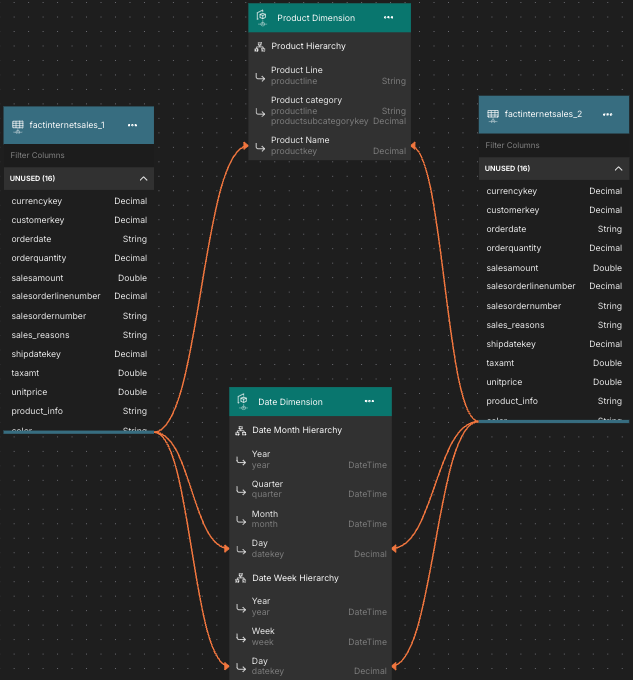
You also create two new metrics, one on each fact dataset, based on the column salesamount. Then, you create a calculated metric that is the sum of the two metrics you just created.
Now, you create the shared degenerate dimension that is based on the currencykey column in factinternetsales_2. To do so, you select the currencykey column in factinternetsales_2, and drag it onto the Canvas.
Figure 2. The new degenerate dimension on the Canvas
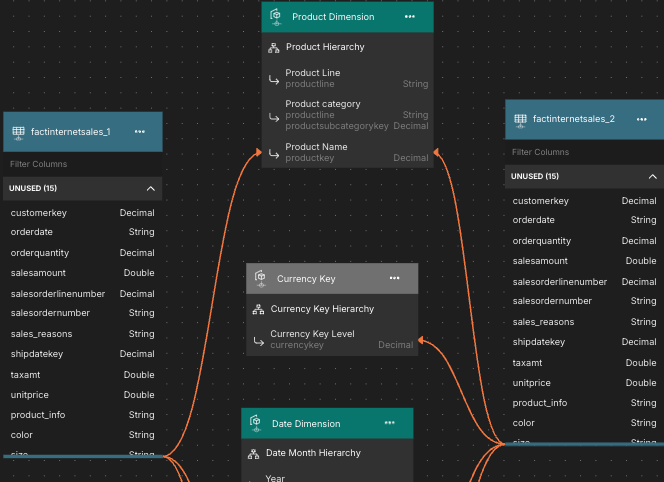
To also use this degenerate dimension with the fact dataset factinternetsales_1 and make it a shared degenerate dimension, you drag currencykey from that table onto the dimension. You now see that both fact datasets have relationships that connect them to the shared degenerate dimension.
Figure 3. The relationships from each fact dataset to the shared degenerate dimension
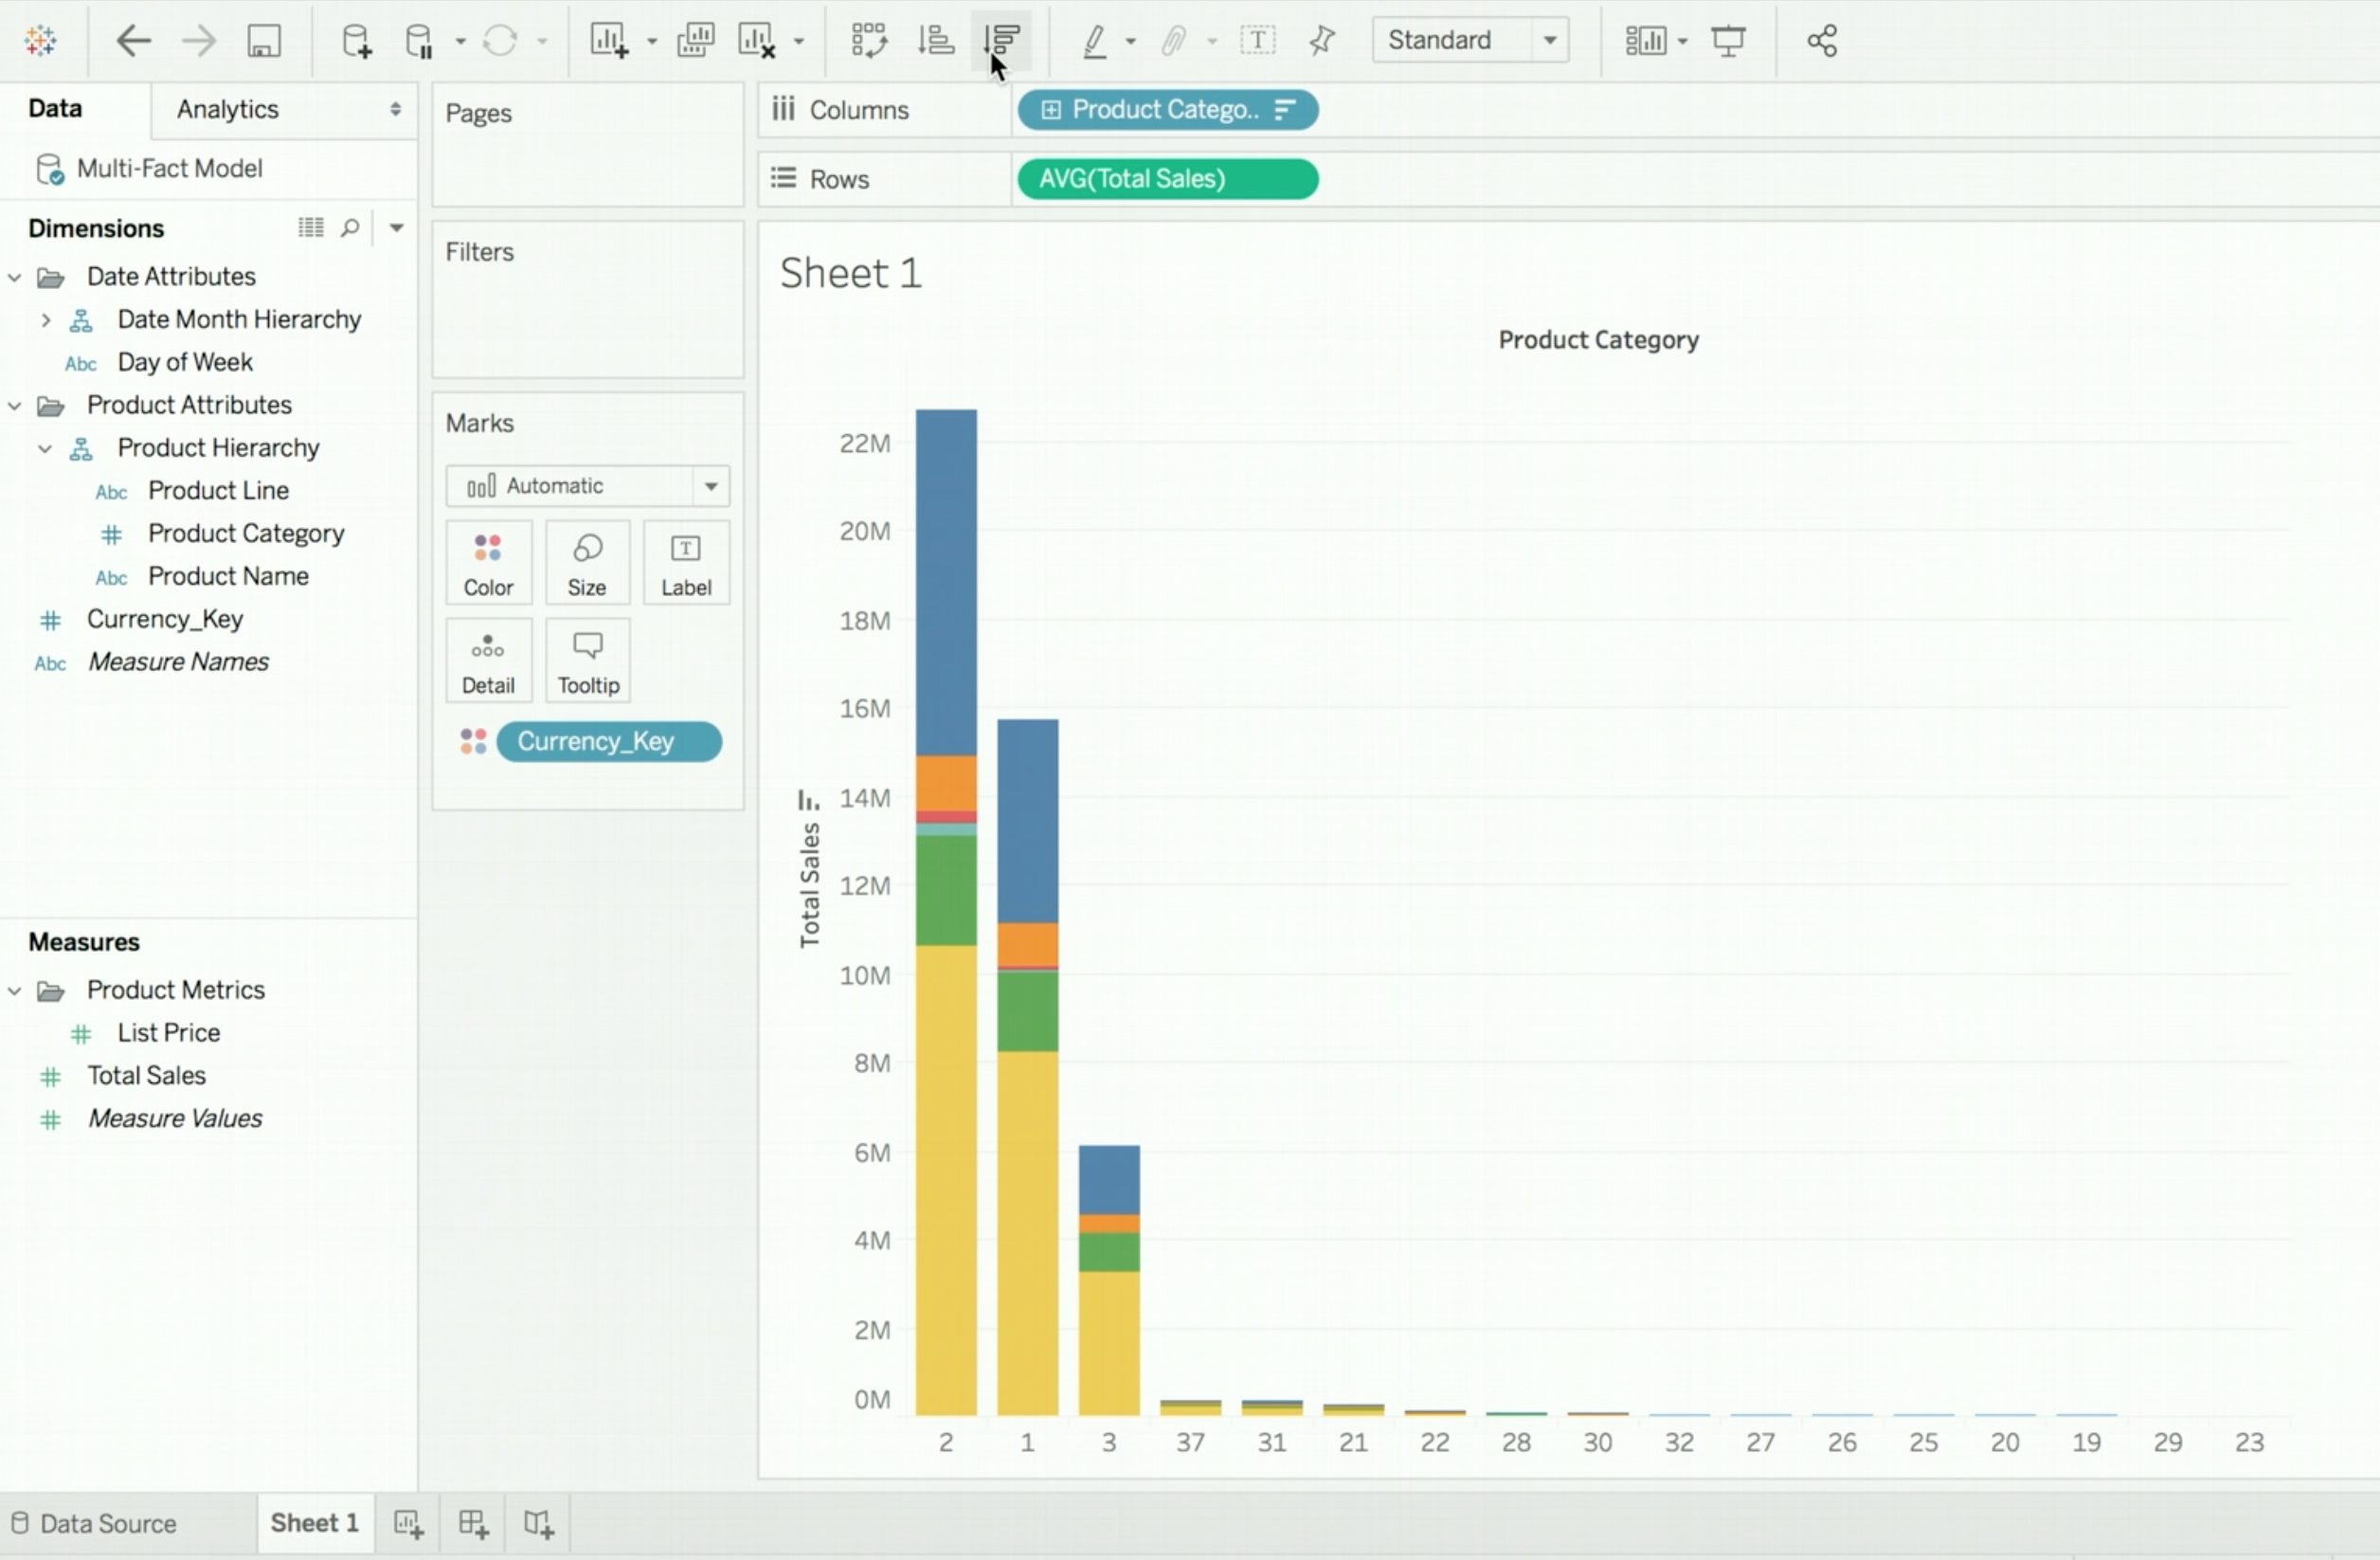
If you now publish the project and connect to the .tds file from Tableau, place Total Sales on the Rows shelf, Product Category on the Columns shelf, and highlight the values of Currency_Key by color, you can see the frequency of the use of the different currency keys across the product categories.
Figure 4. The frequency of the use of the different currency keys across the product categories
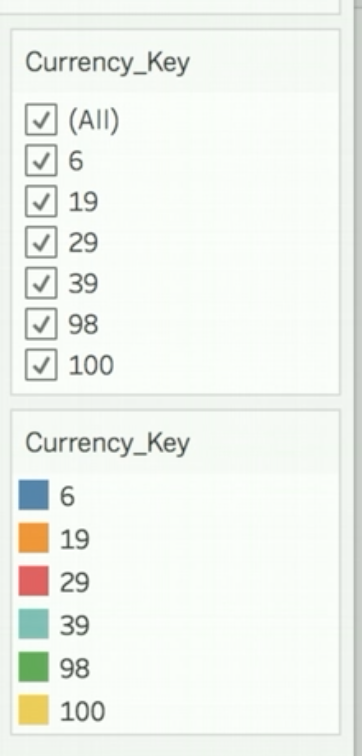
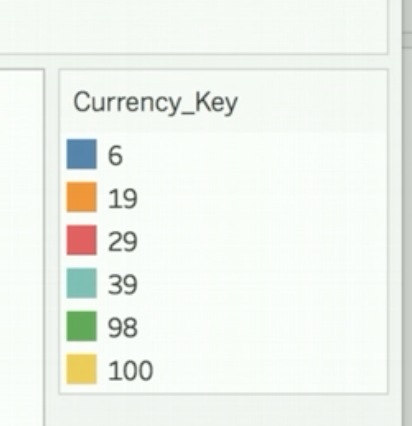
As indicated by this legend, the full range of currency keys in both fact datasets is being used in the display.
Figure 5. The color legend for the bar chart
Moreover, if you drag Currency_Key into the Filters box, the fullrange of values is also available for filtering.
Figure 6. The selection box for filtering on the values of Currency_Key
