Monitoring Cluster Health
Orchestrator provides tools to monitor the health of the nodes in your cluster. In particular, the Orchestrator monitors queries that run across the nodes in your virtualization layer.
AtScale provides customizable rules that allow the Orchestrator to automatically retry queries after a certain amount of time if the queries on your worker nodes hang or fail. The Orchestrator also notifies you of rule violations so that you can manually take action when necessary.
View and Configure Rules
On the Orchestrator page, click the Rules tab to view and edit all available query rules that the Orchestrator monitors. When any of these conditions is violated, you can view a notification of the violation on the Violations tab, or on the Violations panel on the Nodes canvas.
The rules are:
- Worker memory used
- Virtualization failed tasks
To turn a rule on or off, click the On/Off toggle that appears next to that rule.
To edit a rule, hover your cursor over the rule. Click the arrow that appears at the leftmost end of the row to view the configuration fields for that rule. Make your desired update and then select Save Changes.
Figure 1. The Rules tab in the Orchestrator.

View Violations
On the Orchestrator page, the Nodes canvas displays a Violations panel that displays recent violations that have occurred on your cluster. An example of a violation would be attempting to set two nodes as either supervisor, or listener.
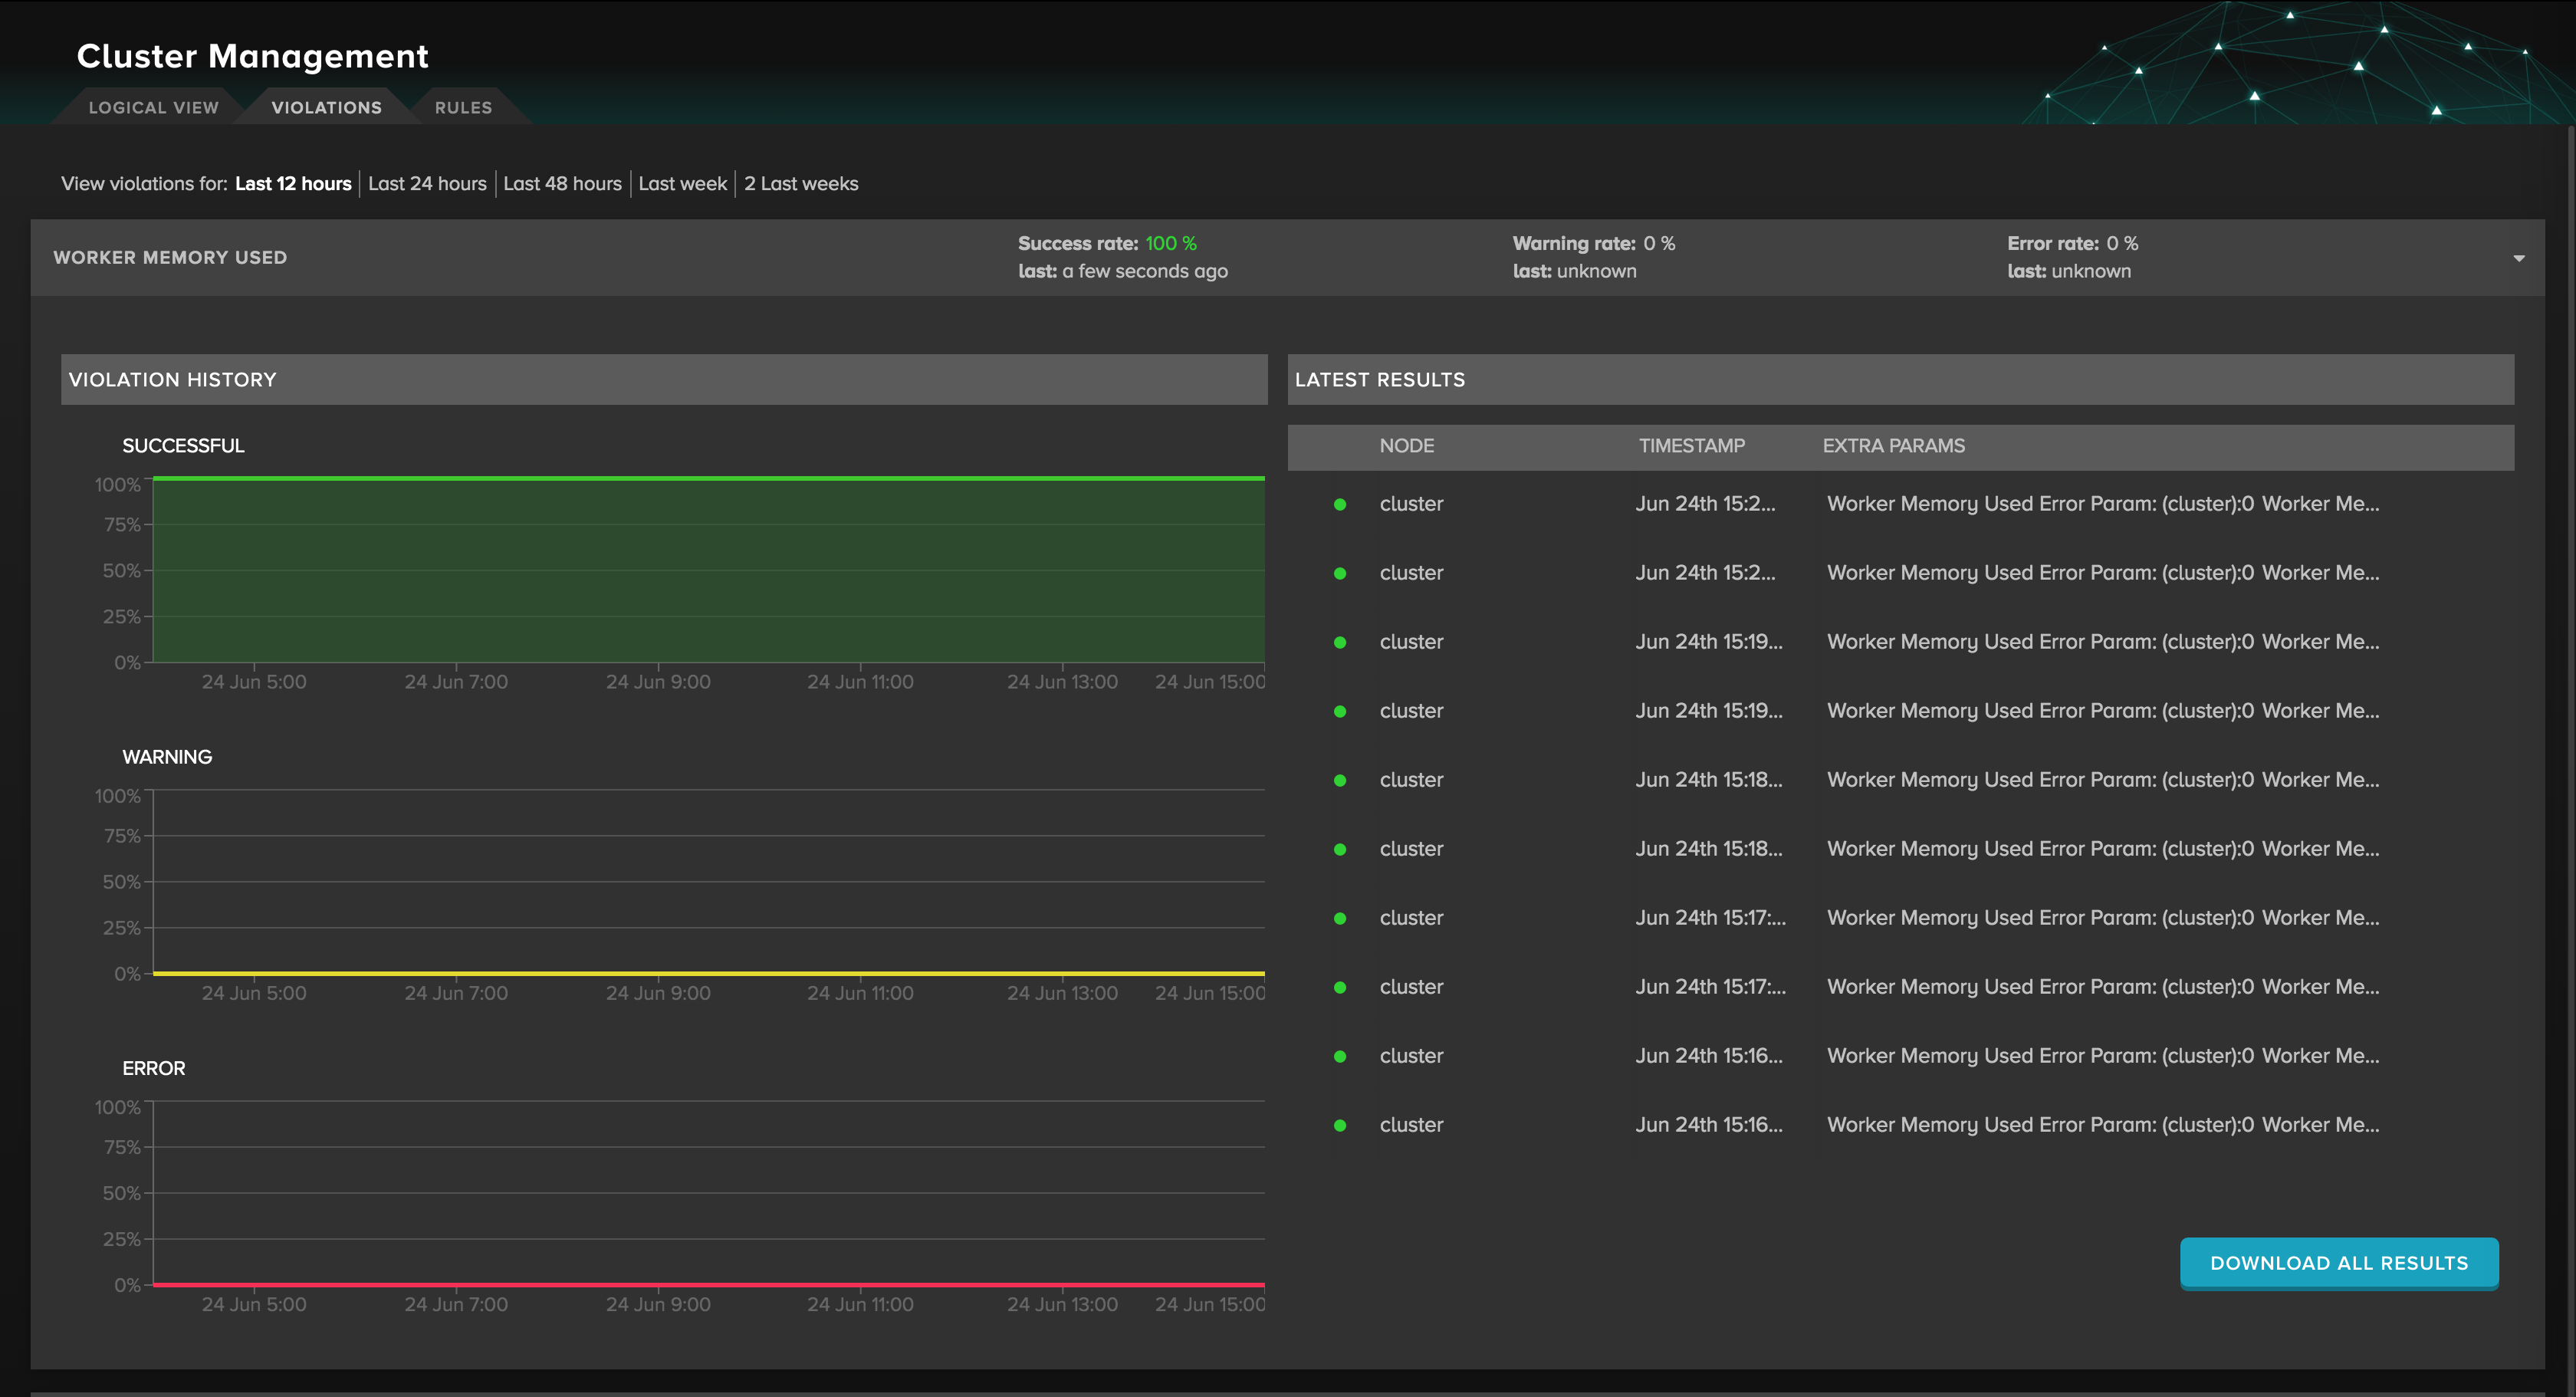
You can go to the Violations tab to view a full list of rules violations on the cluster that have occurred in the last 12, 24, or 48 hours or past week or two weeks. The following rates can be monitored as well. Expanding the worker memory used or virtualization failed tasks gives a detailed graph view of the cluster and date of when violations occurred.
- Success rate
- Warning rate
- Error rate
Figure 2. The Violation History for "Worker Memory Used".
