Monitoring Aggregate Usage
You can view what aggregates have been created, when they were last built, and how often they have been used by a query. You can also see the status of instances, the history of instances for each aggregate, and the history of aggregate maintenance jobs.
About this task
Using the Aggregates tab, a wide range of information can be explored using your aggregate's definition, instance, build history, and maintenance history. Filters help you to narrow down your search to reveal pertinent aggregate related information.
Consider that when the status of an aggregate definition or instance is Pending, this means it is scheduled. For details, see Scheduler for Aggregate Creation.
Viewing the Aggregates Tab
At the top of the Design Center, click Aggregates.
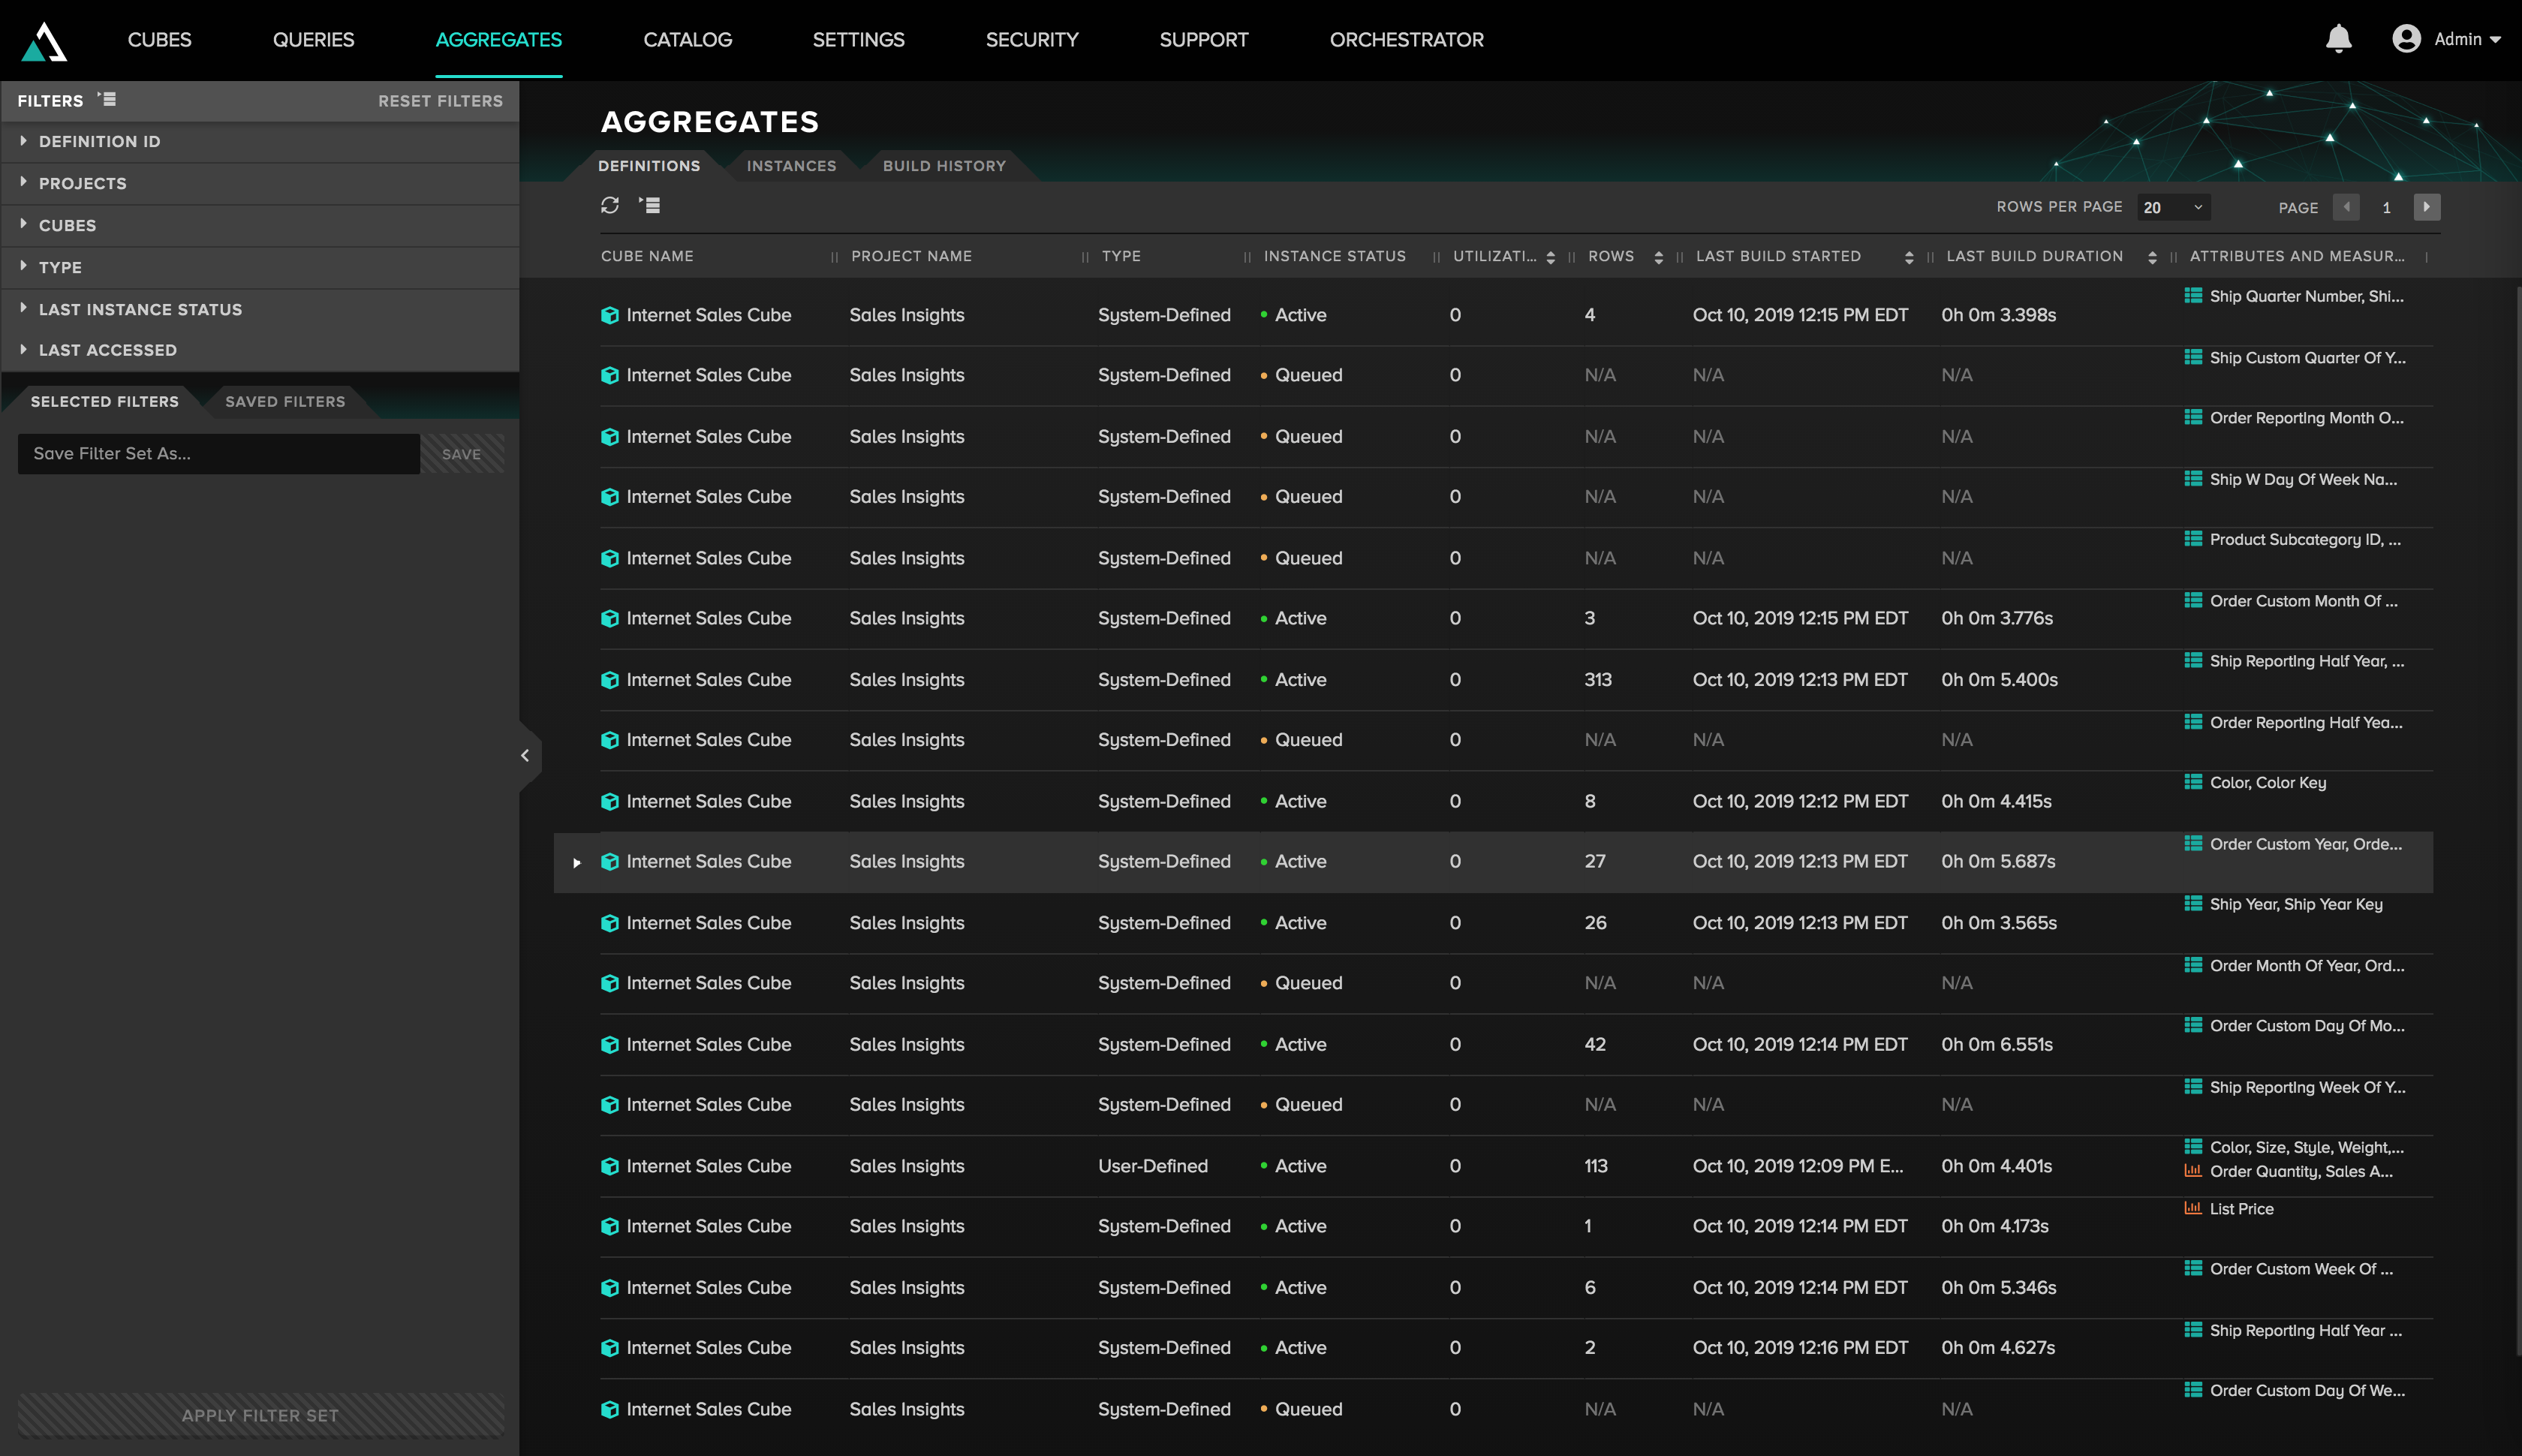
- Select the Definitions tab to view information on aggregate definitions.
- Select the Instances tab to view information on aggregate instances.
- Select the Build History tab to view information on aggregate builds and re-builds.
- Select the Maintenance History tab to view information on when the aggregate maintenance job was run.
You can control what information is displayed using the buttons below these tabs:
- Choose Refresh to display the most recent information.
- Choose Expand rows to see more details about the entries in the history.
Figure 1. The Aggregates page

Aggregate Definition Filters
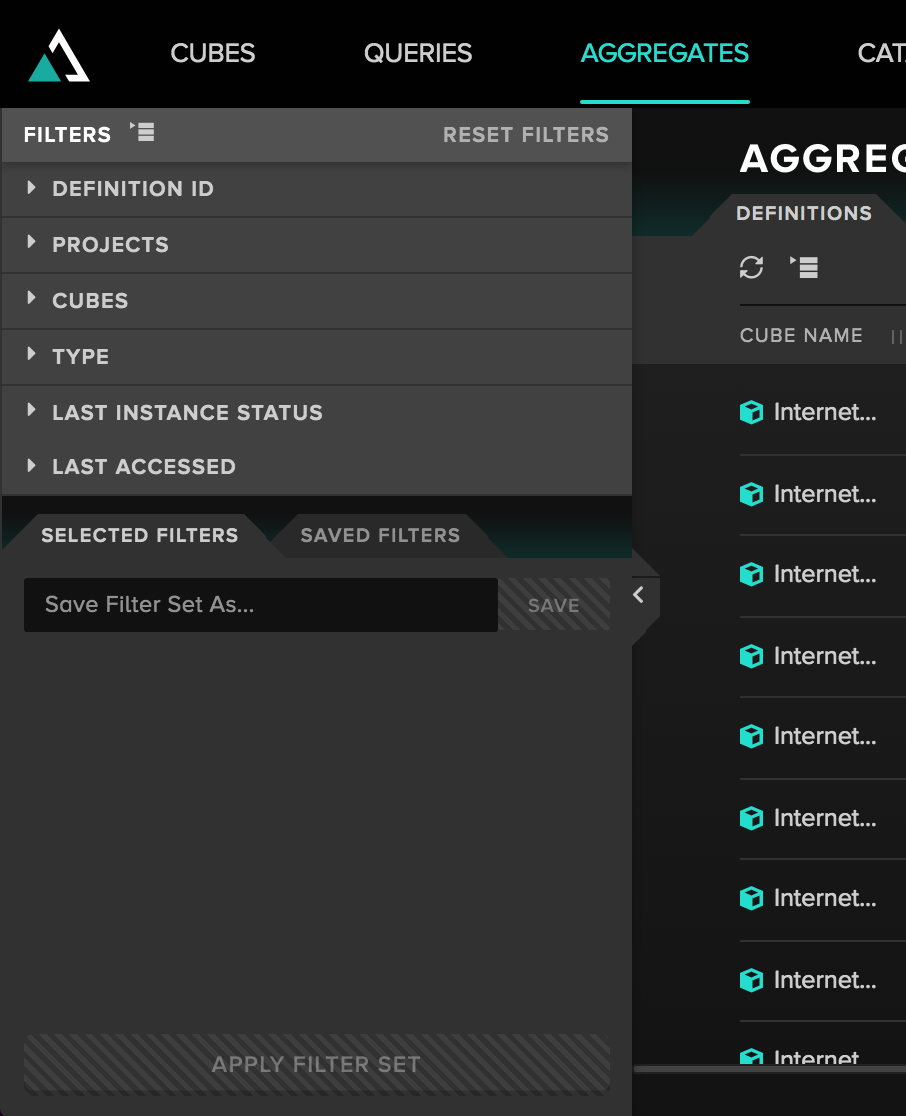
The following filters can be applied to aggregate definitions from the left-hand filters drawer:
-
The definition's ID.
-
The name of the project in which the aggregate's associated cube is located.
-
The name of the cube that is associated with the aggregate definition.
-
The aggregate's type, which can be one of the following types:
- System-Defined: Demand-Defined and Prediction Defined Aggregates.
- User-Defined: Manual and Hinted Aggregates.
-
The last instance status of the aggregate, which can be one of the following:
- Active: The definition is complete and available for queries
- Building: The definition is being created
- Cancelled: The definition was cancelled by user request
- Deleted: The definition has been deleted
- Failed: The definition failed
- Inactive: The definition is no longer being used
- Pending: The definition is pending
- Queued: The definition is in queue for building
- Staged: The definition is complete, but is waiting for a remaining batch to complete before being activated
- Unavailable: The definition should be available, but cannot be accessed
-
When any query last accessed the aggregate definition. Filter on a range of dates, or the past n day(s), hour(s), or minute(s).
Figure 2. Aggregate definition filters

Additional Aggregate Definition Information
The following information can be found in the columns beneath the Definitions tab.
- Last Build Started: When the process that built the most recent definition began. In case an aggregate instance is currently building, here you can see its start time.
- Last Build Duration: How long the process that built the most recent aggregate lasted. In case an aggregate instance is currently building, here you can see its current duration.
- Attributes and Measures present in the aggregate definition.
- Rows: How many rows the most recent definition contains.
- Utilizations (Cumulative): How many times overall queries have accessed definitions of the aggregate since its inception.
Clicking the rows, utilization, and last build started column names will result in a ascending/descending sort.
The following information can be found by hovering over an individual aggregate definition, and clicking it.
-
Definition Status: Whether the aggregate is usable, or unusable.
-
Instances: A link to the aggregate instance associated with the definition.
-
Last Build Ended: When the most recent build of the aggregate completed.
-
Last Accessed: When any query last accessed the aggregate definition.
-
Aggregate Name: Applicable if the aggregate is a UDA.
-
Aggregate ID: The unique ID associated with the aggregate.
-
Created Date: The point of inception for the aggregate.
-
Utilizations (Cumulative): Query usage of the aggregate since the inception of the aggregate.
-
Utilizations (Recent): The total number of queries that have used the aggregate over the past X number of days.
The number of days corresponds to the value of the Window Size parameter; for details, see Settings for Automatic Removal of Unused Aggregates. Consider that the Utilizations value may not be current, since the job that updates the recent usage counts runs periodically (3 times per day). The value displayed here is not calculated on-demand nor is it recalculated when the browser page is refreshed.
-
Query Saved Time: Amount of time saved due to aggregation.
-
Incremental: If the aggregate will be incrementally updated.
-
Data Warehouse: The data warehouse assigned to the project while modeling.
Aggregate Instance Filters
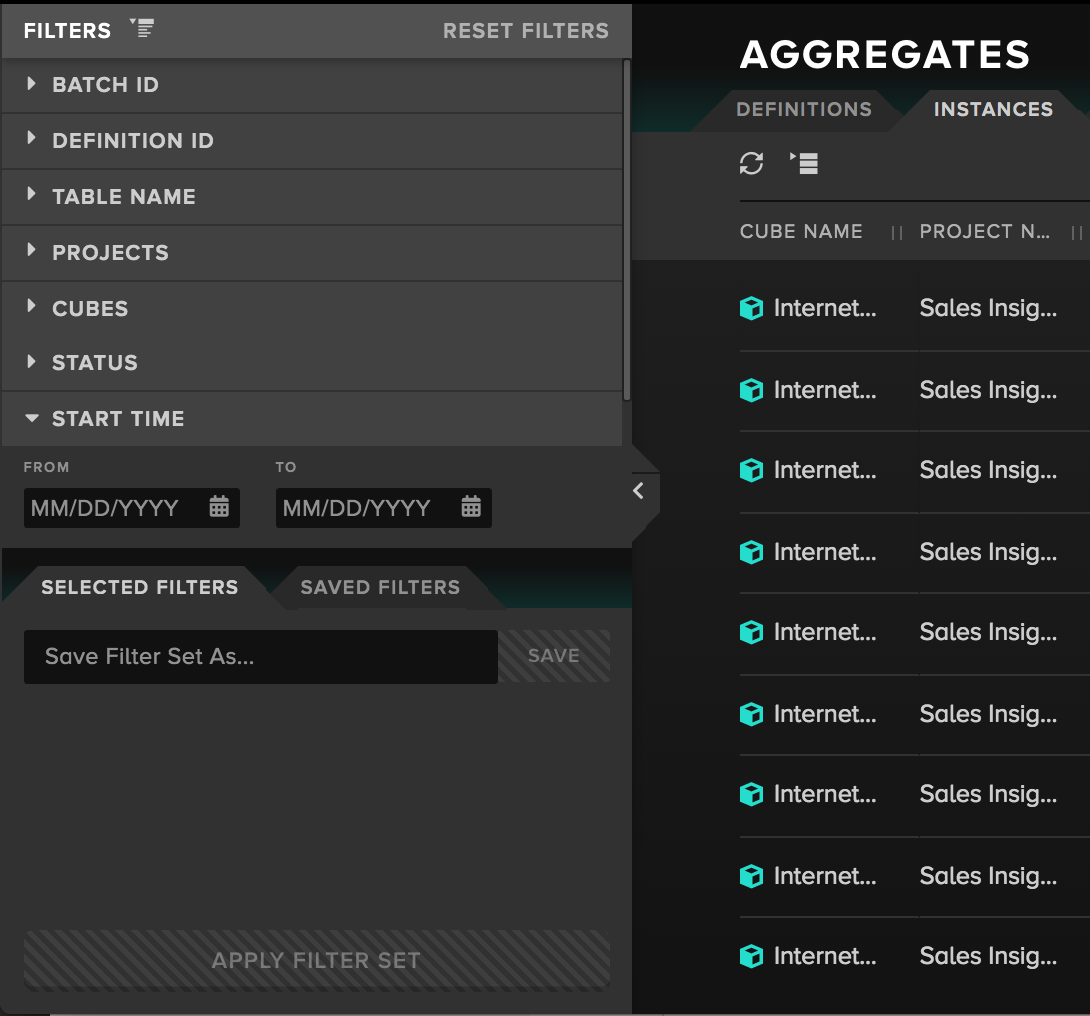
The following filters can be applied to aggregate instances from the left-hand filters drawer:
- The batch id associated with the instance.
- The definition id associated with the instance.
- The table name associated with the instance.
- The name of the project in which the aggregate instance's associated cube is located.
- The name of the cube that is associated with the aggregate instance.
- The status of the aggregate instance. The values are the same as the statuses for definitions listed above.
- The start time of when the process to build the instance began. Can filter on a range of dates, or the past n day(s), hour(s), or minute(s).
Figure 3. Aggregate instance filters

Additional Aggregate Instance Information
The following information can be found in the columns beneath the instances tab.
- Rows: How many rows the most recent instance contains. Clicking the word Rows results in an ascending/descending sort for the number of rows in your aggregate instance.
- Duration: How long the process that built the most recent aggregate instance lasted. In case an aggregate instance is currently building, here you can see its current duration.
- Schema.table: The schema and table associated with the aggregate instance, with a message on how the instance was activated.
- Query: A link to the query associated with the aggregate instance.
- Definition: A link to aggregate definition associated with the instance.
- Build: A link to the aggregate build associated with the instance.
Clicking the rows, start time, and duration column names will result in a ascending/descending sort.
Aggregate Build History Filters
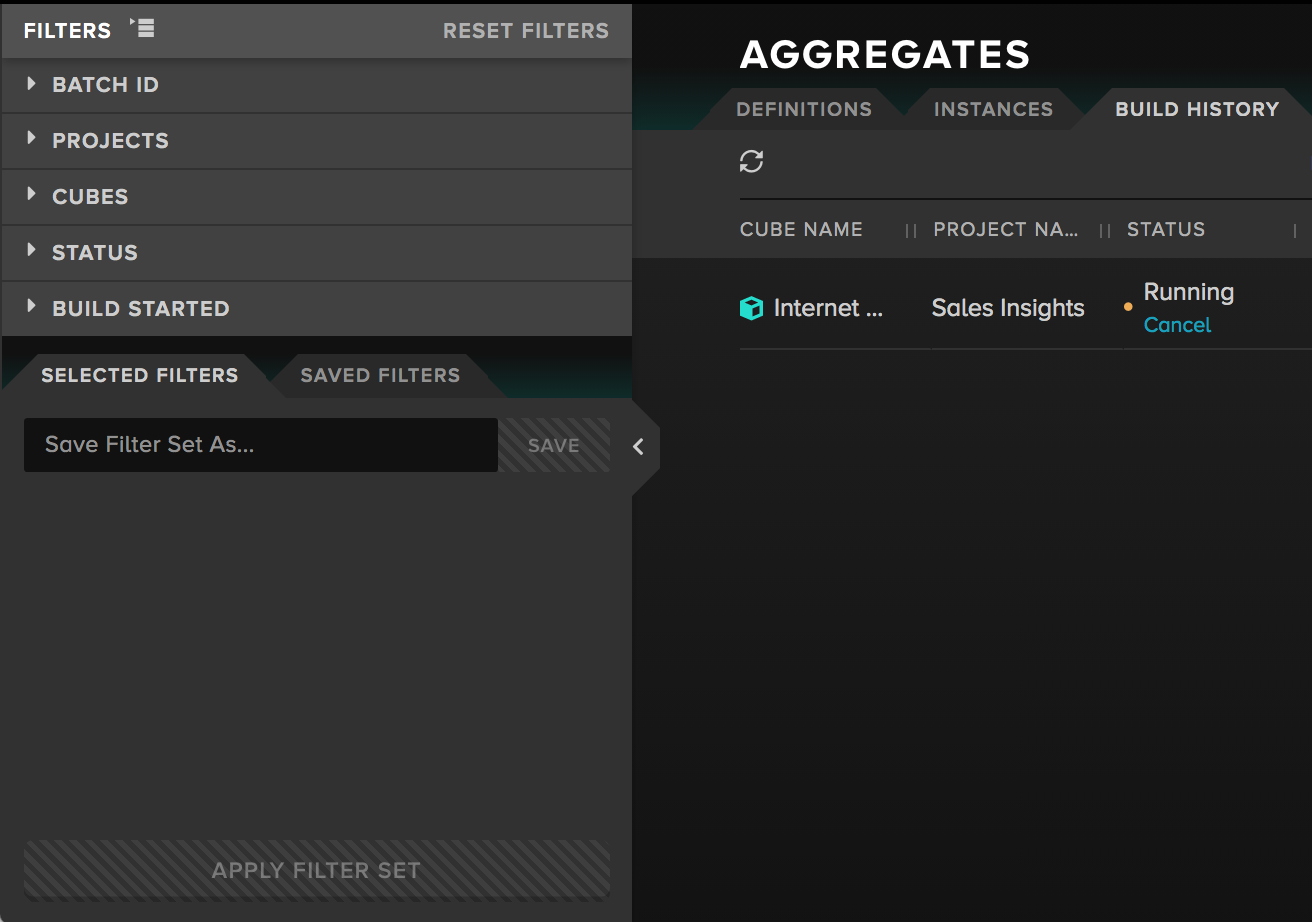
The following filters can be applied to an aggregate's Build History from the left-hand filters drawer:
-
The batch id associated with the build.
-
The name of the project associated with the build.
-
The name of the cube associated with the build.
-
The status of the build, which can be one of the following statuses:
- Successful
- Running
- Failed
- Queued
- Cancelled
-
When the build started. Can filter on a range of dates, or the past n day(s), hour(s), or minute(s).
Figure 4. Aggregate build history filters

Additional Aggregate Build History Information
The following information can be found in the columns beneath the Build History tab.
- Duration: The total time to complete the aggregate build.
- Start Time: When the build was commenced.
- Instances: A link to the instances associated with the aggregate build.
Clicking start time will result in a ascending/descending sort.
Maintenance History
You can filter the list of maintenance jobs by job ID, type, status, and start time. For each job in the list you can see its type, status, start time, and duration. In case a job has failed you can choose it to see more details, like job ID and related messages.
Figure 5. Maintenance history filters

Consider that if you choose the Expand rows button you would see more details only for jobs that have failed.
Saved Filters
You can save filters for future use on all aggregate tabs:
- At the bottom of the Filter pane, enter the filter name and click Save Filter. The saved filter is added to the list on the Saved Filters tab.
- Click the x opposite a filter to clear it.
Click Reset Filters to clear your filter selections.