Reviewing Query Results
Expand upon queries from the queries list to review the progress and results of queries. The query list shows the cube name, project name, query status, start time, duration, user, optimization, and lists attributes and measures for each query.
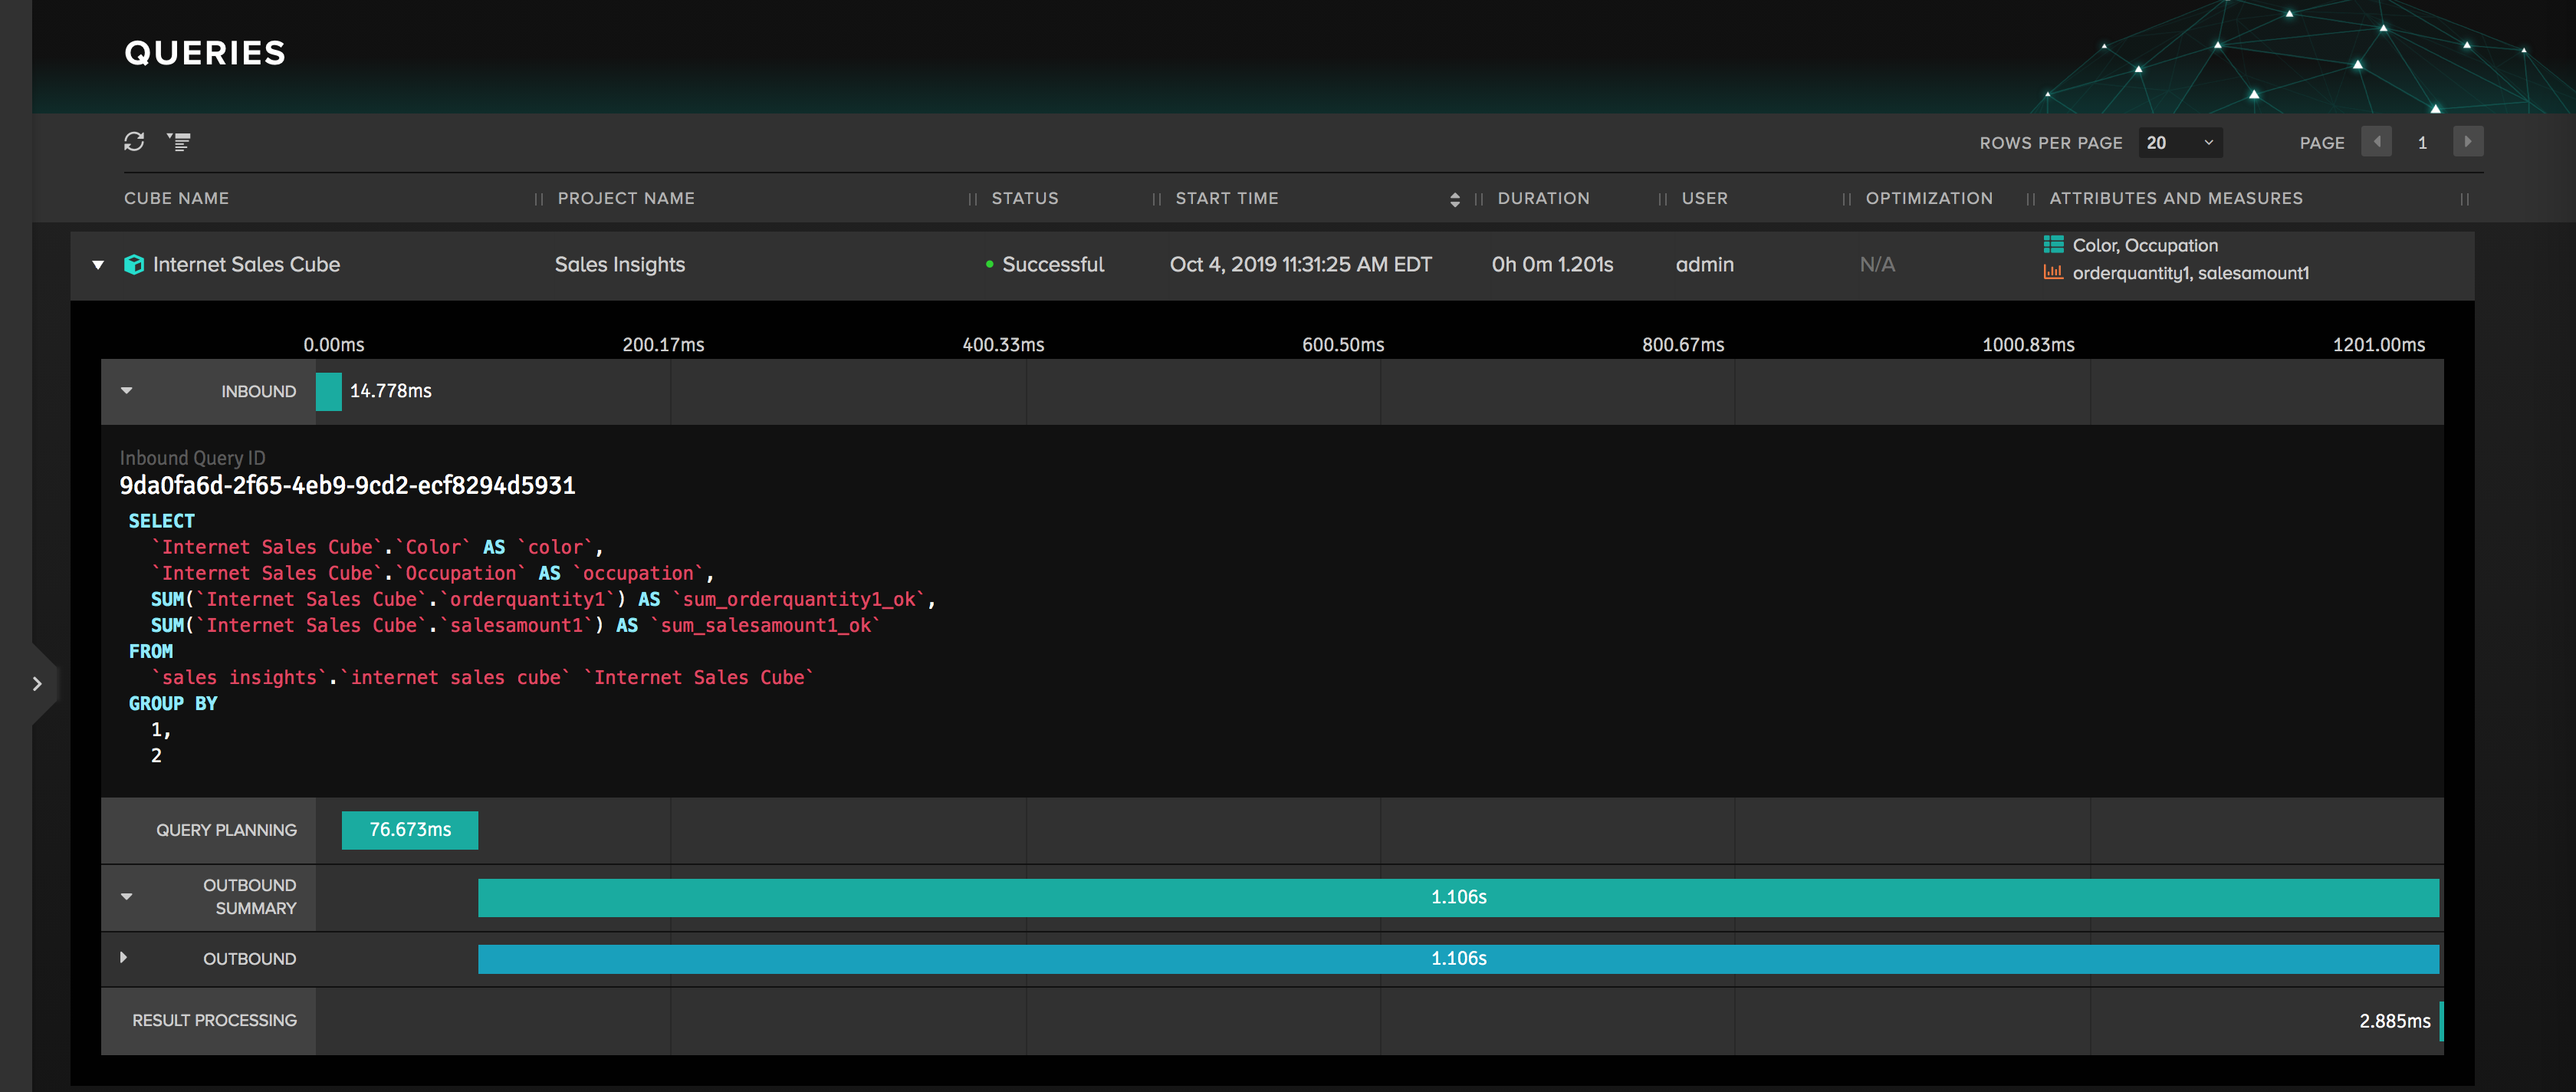
Figure 1. A query with the inbound query details expanded.
Click the angle controls on the left to display details for the inbound and outbound queries. The expanded view shows the following for each user query:
- Inbound: The selected dimensions and measures (in the screenshot: Color, Occupation, Order Quantity and Sales Amount) and the inbound, and query planning duration (See Figure 1).
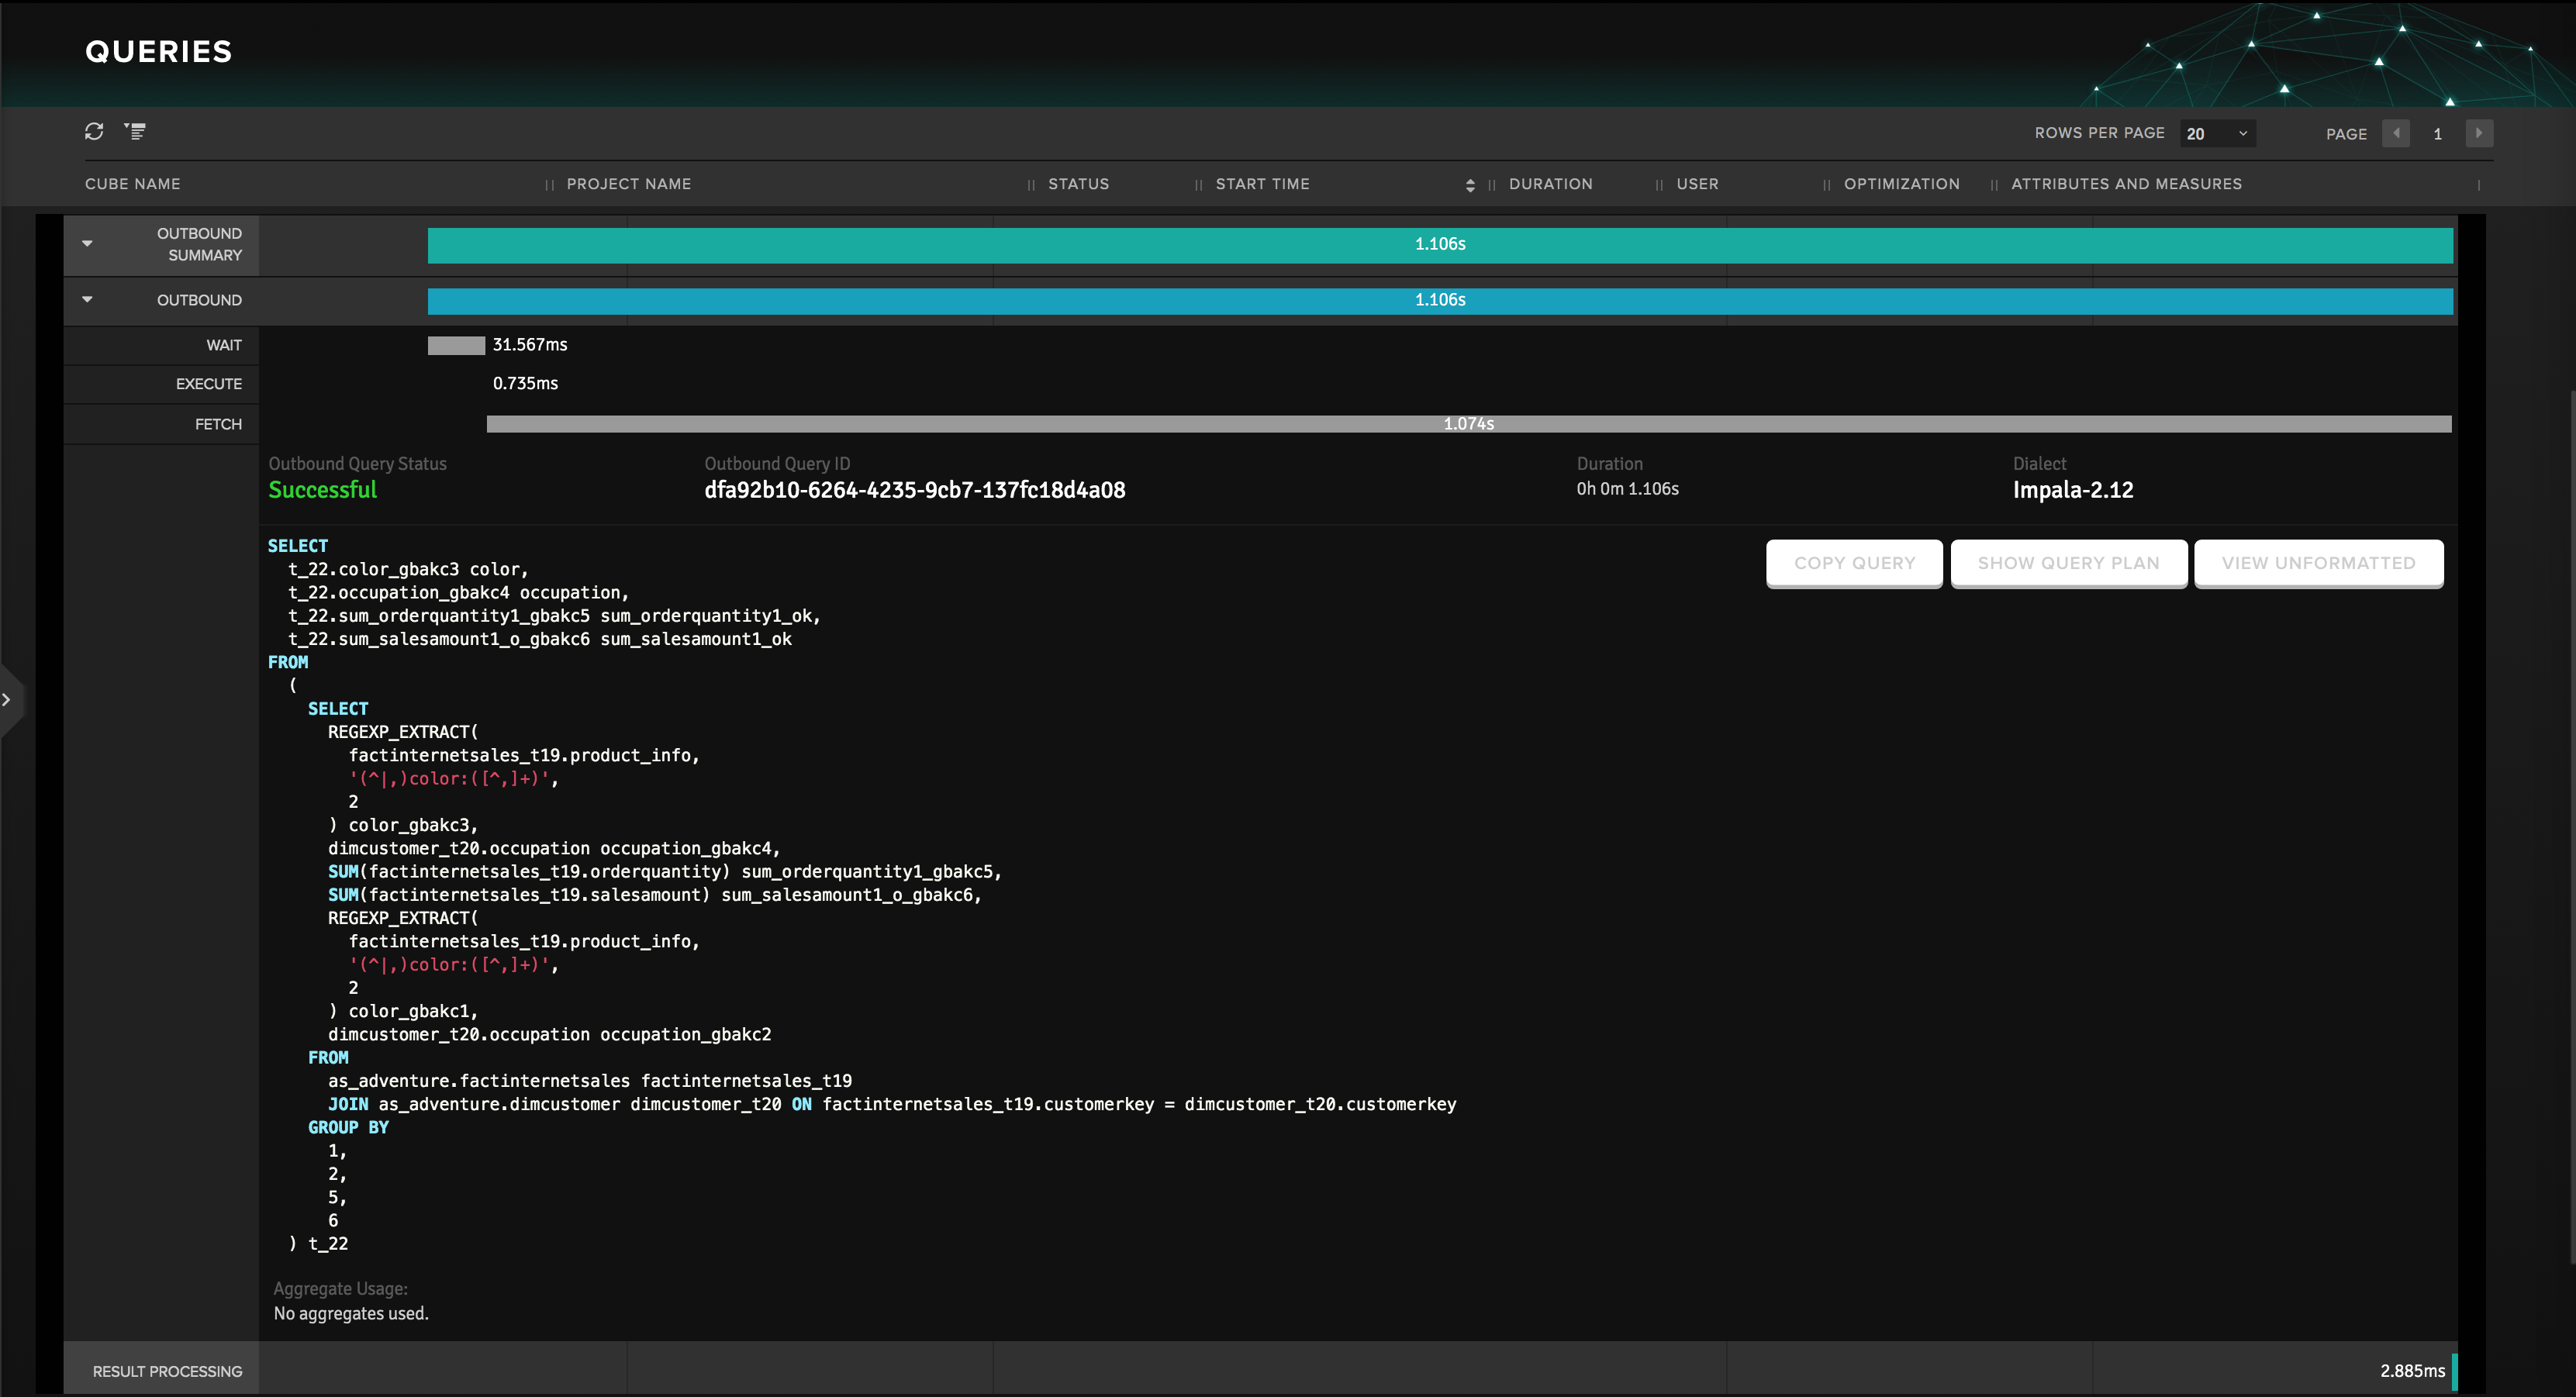
- Outbound: A Gantt chart of the outbound query's status during its phases: Wait, Execute, Fetch and Results Processing (See Figure 2).
Figure 2. A query with the outbound query details expanded.
You can hover over any of the duration bars in the chart to see additional status information. You can also hover over any of the fields in the Gantt chart for additional information on that field.
Large Query Text Display
To ensure that the Query page remains responsive when large inbound and query text strings are returned, two configurable settings are present on the Engine settings page, which control the display of large inbound and outbound queries:
QUERY.CHARACTERLIMIT.DISPLAYINBOUNDdefaulted to 100,000.QUERY.CHARACTERLIMIT.DISPLAYOUTBOUNDdefaulted to 50,000.
If a query exceeds the limit set on either setting, a message will display from the expanded inbound or outbound query reading "This query is truncated because it exceeds the maximum display limit. Click to see the full query." After selecting the message you will be re-directed to a new tab which displays the full query text.
About query phases
Each query passes through several phases while it is handled by AtScale. You can see the amount of time a query spends in each phase. The query phases are color-coded: Blue for successful execution, Red for execution failure, and Green for Results Fetch. This information can be of help for estimating and improving the execution of queries.
For each phase, you can click the angle control on the right to expand it:
- For Inbound, you can see the SQL SELECT statement. You can hover over the query itself to display the Copy Query and View Unformatted buttons.
- For Query planning, you can see the time for planning.
There are several details for the Outbound phase:
- Wait, Execute, and Fetch time.
Note: These times can often be different than the times measured at the data warehouse. The reason is that AtScale uses its own methods for calculating them, taking into account the specifics of transferring and processing the data. As a result, you could observe different results for the same query, both on AtScale and the data warehouse.
-
The Outbound Status, Outbound Query ID, the duration, and the query's dialect (in Figure 2, Impala).
-
The SQL SELECT statement.
You can hover over the query itself to display Copy Query and View Unformatted buttons. If a query plan was used, Show Query Plan will toggle to Hide Query Plan as well. (The query plan is the set of steps that the database management system executes to complete the query.)
-
If an aggregate was used, the aggregate list links to the aggregate definition and aggregate instance in the Design Center.

