Time Dimensions
A time dimension in AtScale is a type of normal dimension that uses a time-based hierarchy. Use time dimensions to support time-based analysis, such as comparing data in parallel periods.
You can designate a time dimension when you create a new dimension or edit an existing one in the Design Center. To do so, in the dialog to create or edit the dimension, set the Type field to Time.
Because time type dimensions were introduced in AtScale 2019.2.0, any dimension created in AtScale 2019.1.x or earlier was automatically created as a standard type dimension, even if it had a time-based hierarchy. Starting from AtScale 2019.2.0, you can edit an existing normal dimension's type from standard to time. (See Edit the Dimension Type.)
Note: As of AtScale 2021.3.0 it is possible to build tabular reports that use hierarchy-specific calculations, such as Time Calculations, without specifying the Hierarchy in the report or query. See the Level Alias documentation for more information.
Time Dimension Requirements
Time dimension levels have strict ordering requirements. In order to make correct comparisons between time periods it is critical that following requirements are met:
- Levels must have their "Sort Column" set to a column that correctly represents the time members of the level when sorted in ascending order. In most cases it is sufficient to set the "Order by" column to the same column as the level's key.
- If the level uses a compound key, the "Order by" column must point to a field that sorts in the equivalent order as the compound key. If no such column exists, consider creating a single calculated column that combines the components of the level key into a single, sortable field.
- SQL BI Tools such as Tableau frequently ignore the sort order returned by the AtScale OLAP cube, and instead sort rows alphanumerically by member name instead of key value. This tool behavior doesn't affect the time calculations in the AtScale cube. However, it will return rows in a confusing sort order (e.g. "August 2019" before "July 2019"). To prevent this, use a name column that has an alphanumeric sort order that matches the ascending order of time (e.g. "2019-07 (Jul)", "2019-08 (Aug)")
Note: When modeling Date Hierarchy Levels in AtScale, consider that setting Name column bindings to a String column type is not compatible with Looker. To be compatible with Looker's date capabilities, these Name column bindings must reference a date-like database column such as: Date, DateTime, or Timestamp.
Known Limitation for MDX interfaces
For MDX interfaces (such as Excel), multiple time dimension members
cannot be used in the same slicer or filter simultaneously. For example,
first slice on Year 2017 and Year 2018, and then filter between
1/1/2017 and 1/1/2018.
As a workaround, when you select a filter or slicer you can include the desired offset measure, which uses a calculated measure function as a selected value. For example, instead of slicing Sales Amount by Years 2017 and 2018, simply slice Sales Amount by 2018. Then select a calculated measure that retrieves the sales from the previous year using either Lag or ParallelPeriod.
This limitation does not affect SQL interfaces.
Custom Parallel Period Comparisons
You can use the ParallelPeriod function to compare members in the same relative child positions of different time hierarchy levels (for example, comparing this year's April sales to last year's April sales). But sometimes you must compare periods that may not be in the same relative position. For instance, in a 4-4-5 calendar, you'll sometimes have to compare a 53-week year to a 52-week year. By default, Week 53 compares to a NULL value because the previous year only has 52 weeks. In this case, many businesses compare Week 53 to the previous year's Week 52. To accomplish this, define a custom parallel period comparison for each level in your time hierarchy and comparison you wish to make. A custom comparison tells AtScale to use a database column in your time dimension table that contains key values pointing to the desired parallel period.
To define a custom parallel period comparison, you must first create a custom parallel period key column in the source table. This column must have the same type as the level's key column. Then in AtScale, add the custom parallel period comparison to the desired time hierarchy level, along with the comparison period size (e.g. Year, Half-Year, Quarter, etc). To do so, edit the level and click Add Custom Comparison in the Edit Level dialog.
You can add multiple custom parallel period comparisons to a level. Continuing with the 53-to-52 week, one-year comparison example, choose a Key Column that has records pointing to the desired key one year in the past. The column should always represent data offset by one unit of the selected period type. AtScale handles ParallelPeriod offset indexes greater than one by reading multiple rows from this column. For example, to perform a custom five-year comparison, you would still use a key column that has a one-year lookback, but pass an offset value of five to the ParallelPeriod function.
Parallel Period Grouped by Secondary Attributes
As of AtScale version 2020.1.0, AtScale supports the ParallelPeriod function with Secondary Attributes when querying.
It is important to note that grouping ParallelPeriods by secondary attributes only works if the query also uses the hierarchy referenced by the ParallelPeriod expression, such as in a row, column or where constraint.
Use Cases
The following use cases are examples from AtScale's Sales Insights demo data, in which time dimensions are used for time-based sales analysis. The calculated measures shown in each MDX example use the following time intelligence MDX functions to navigate through time dimensions: LEAD, LAG, PREVMEMBER, NEXTMEMBER, CURRENTMEMBER, PERIODSTODATE, and PARALLELPERIOD.
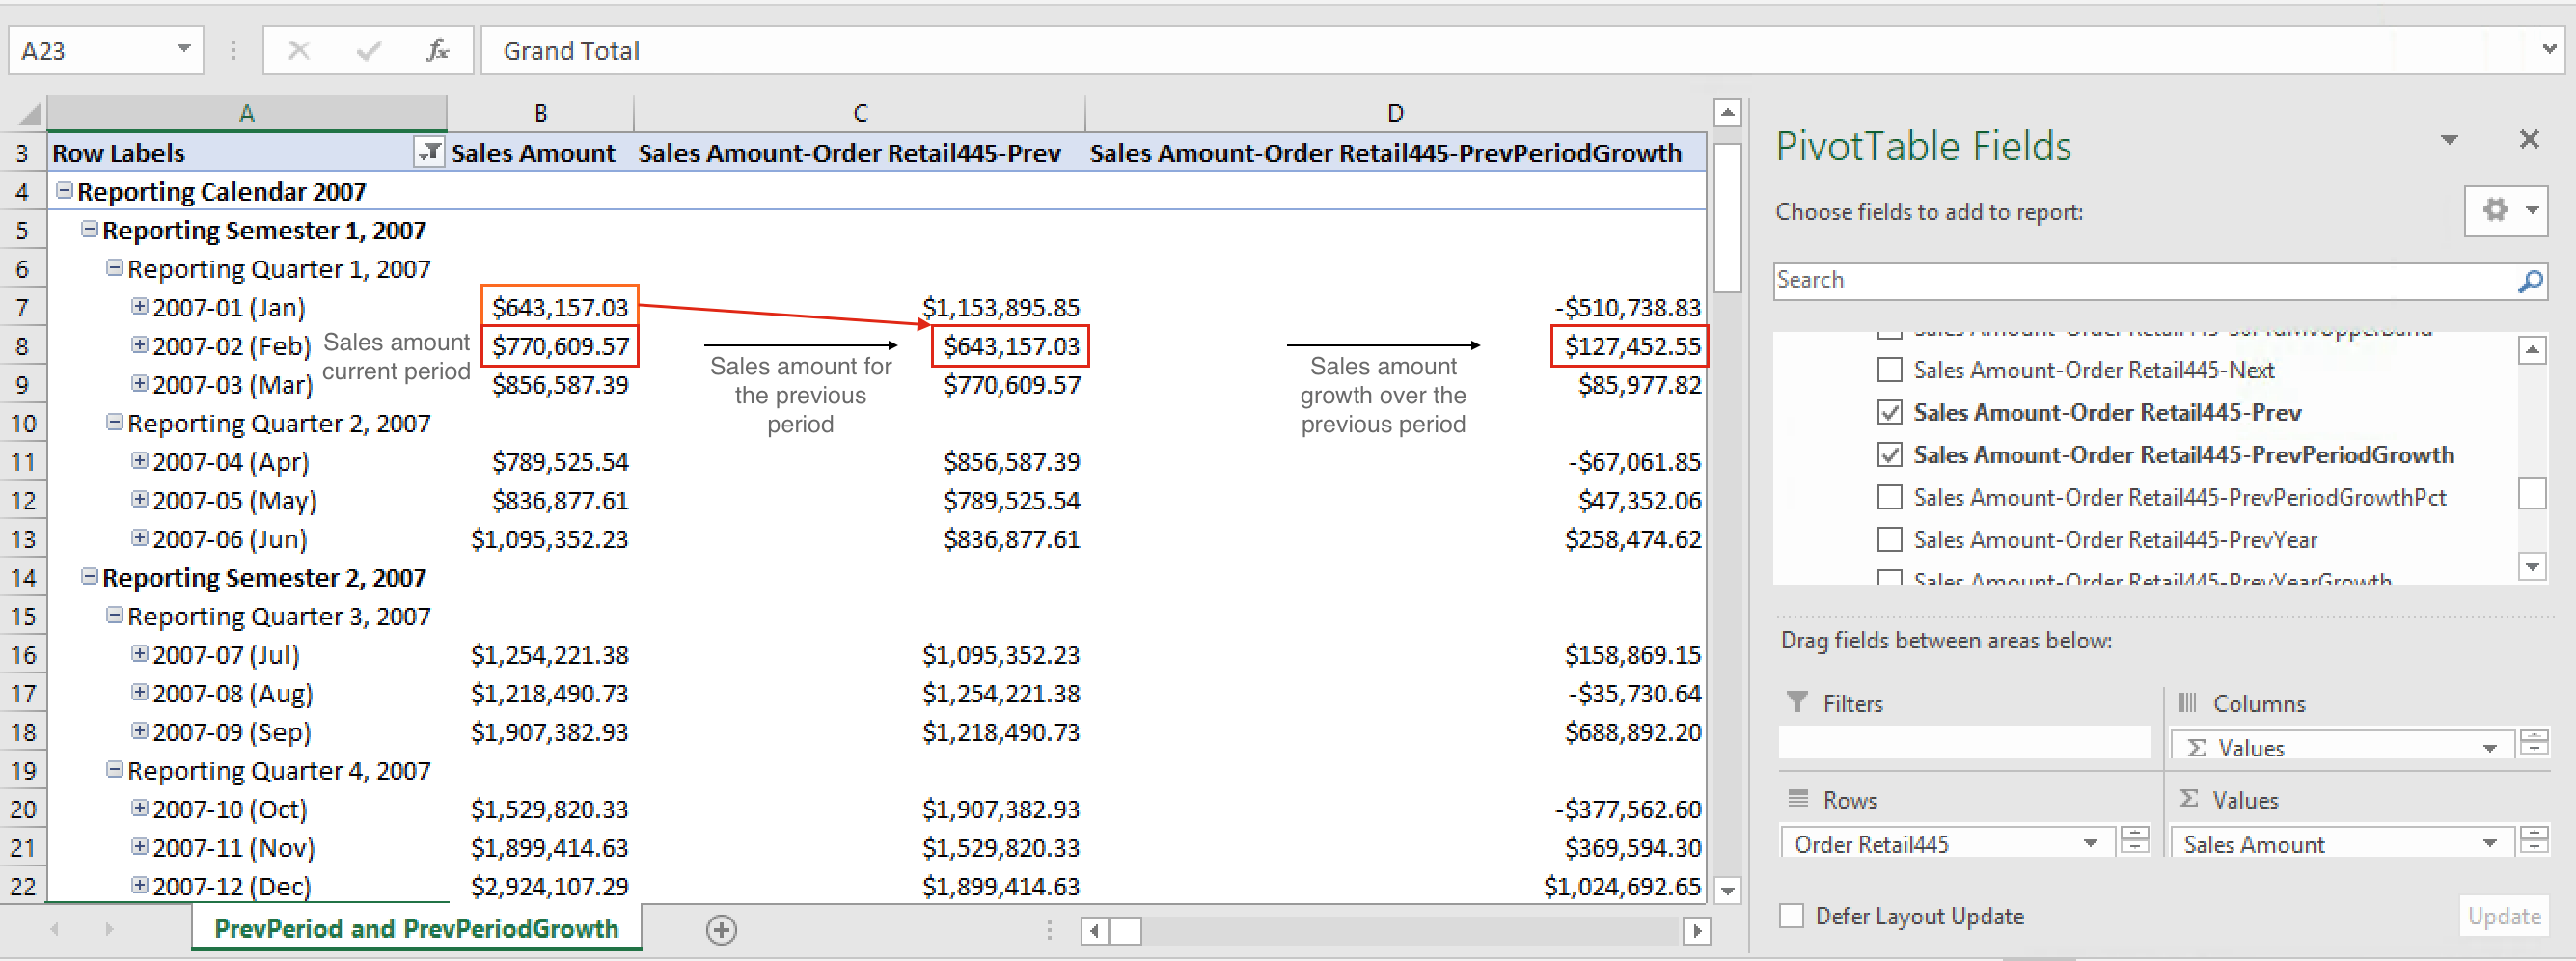
Period-over-period growth for sales amounts
In this use case, the calculated measures below can be used to compare sales growth of the current period to the previous period. These calculated measures use CURRENTMEMBER, LAG, and PREVMEMBER to calculate the sales amount for the previous period and the sales amount growth over the previous period.
-
-
Calculated measure for sales amount for the previous period:
[Measures].[Sales Amount-Order Retail445-Prev]
([Order Date Dimension].[Order Retail445].CurrentMember.PrevMember, [Measures].[salesamount1]) -
-
-
Calculated measure for sales amount growth over the previous period:
[Measures].[Sales Amount-Order Retail445-PrevPeriodGrowth]
([Order Date Dimension].[Order Retail445].CurrentMember, [Measures].[salesamount1])
-
[Measures].[Sales Amount-Order Retail445-PrevYear] -
Figure 1. Tableau workbook use cases 1 and 2
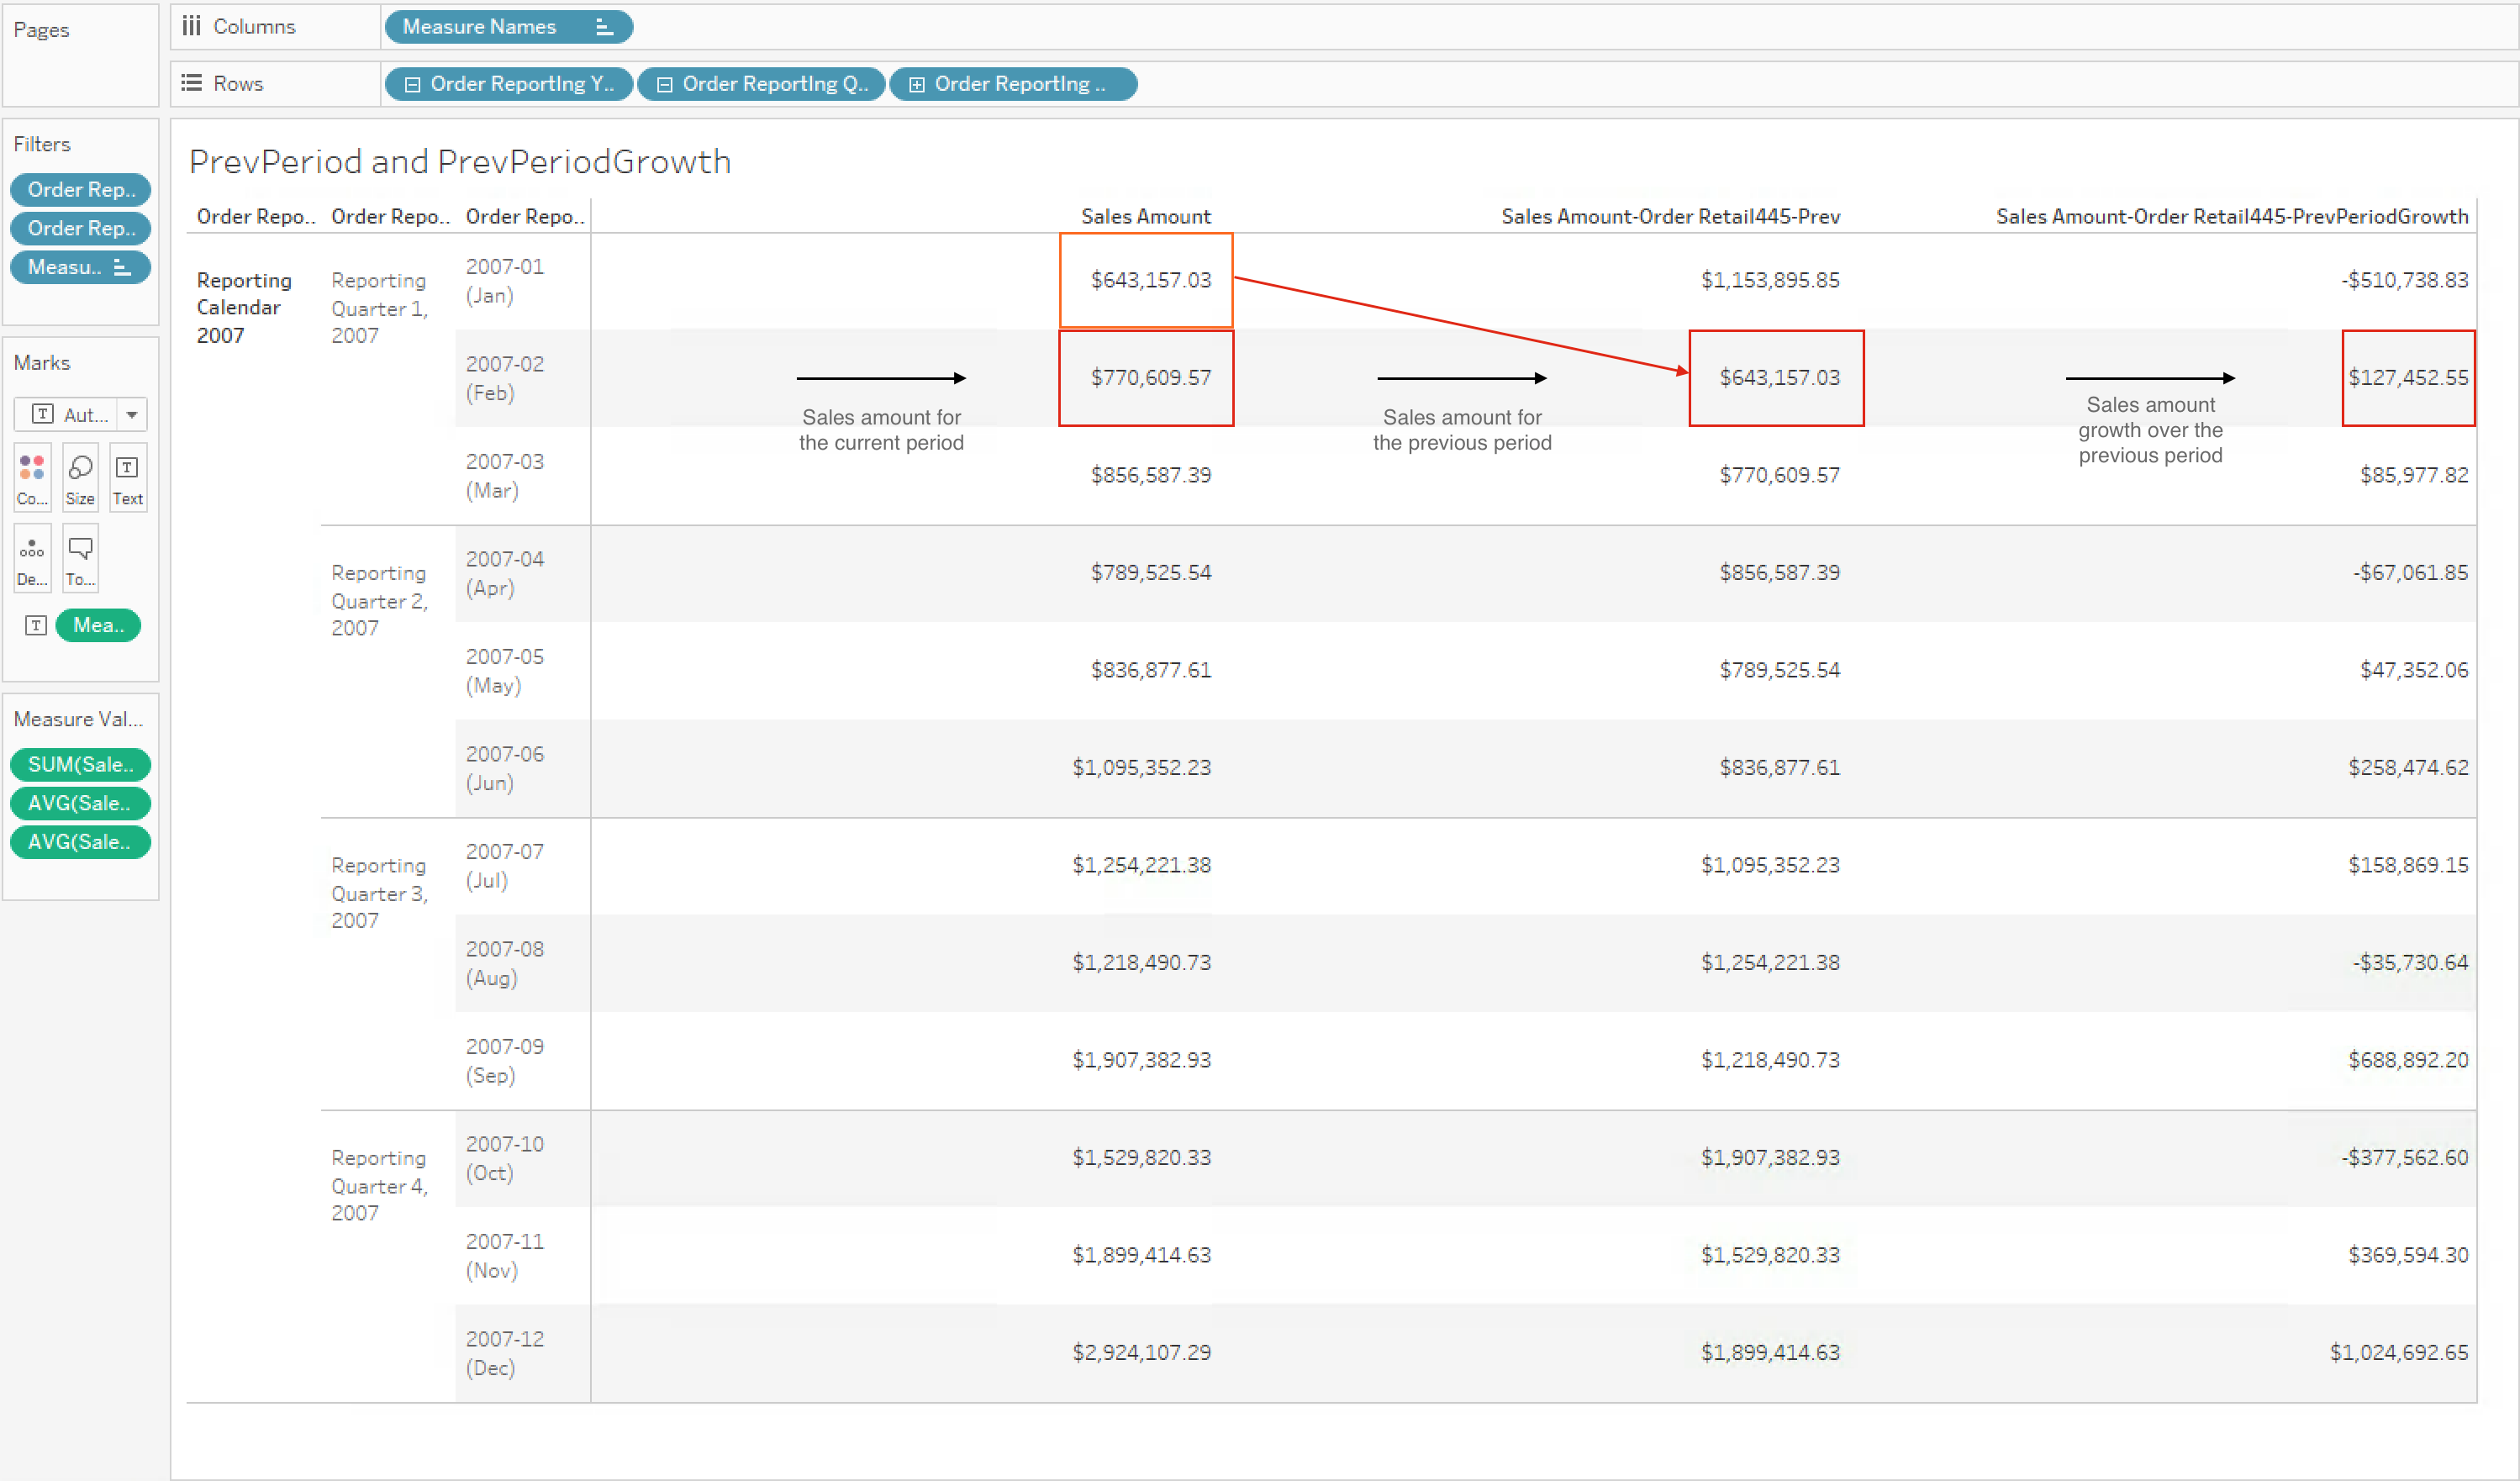
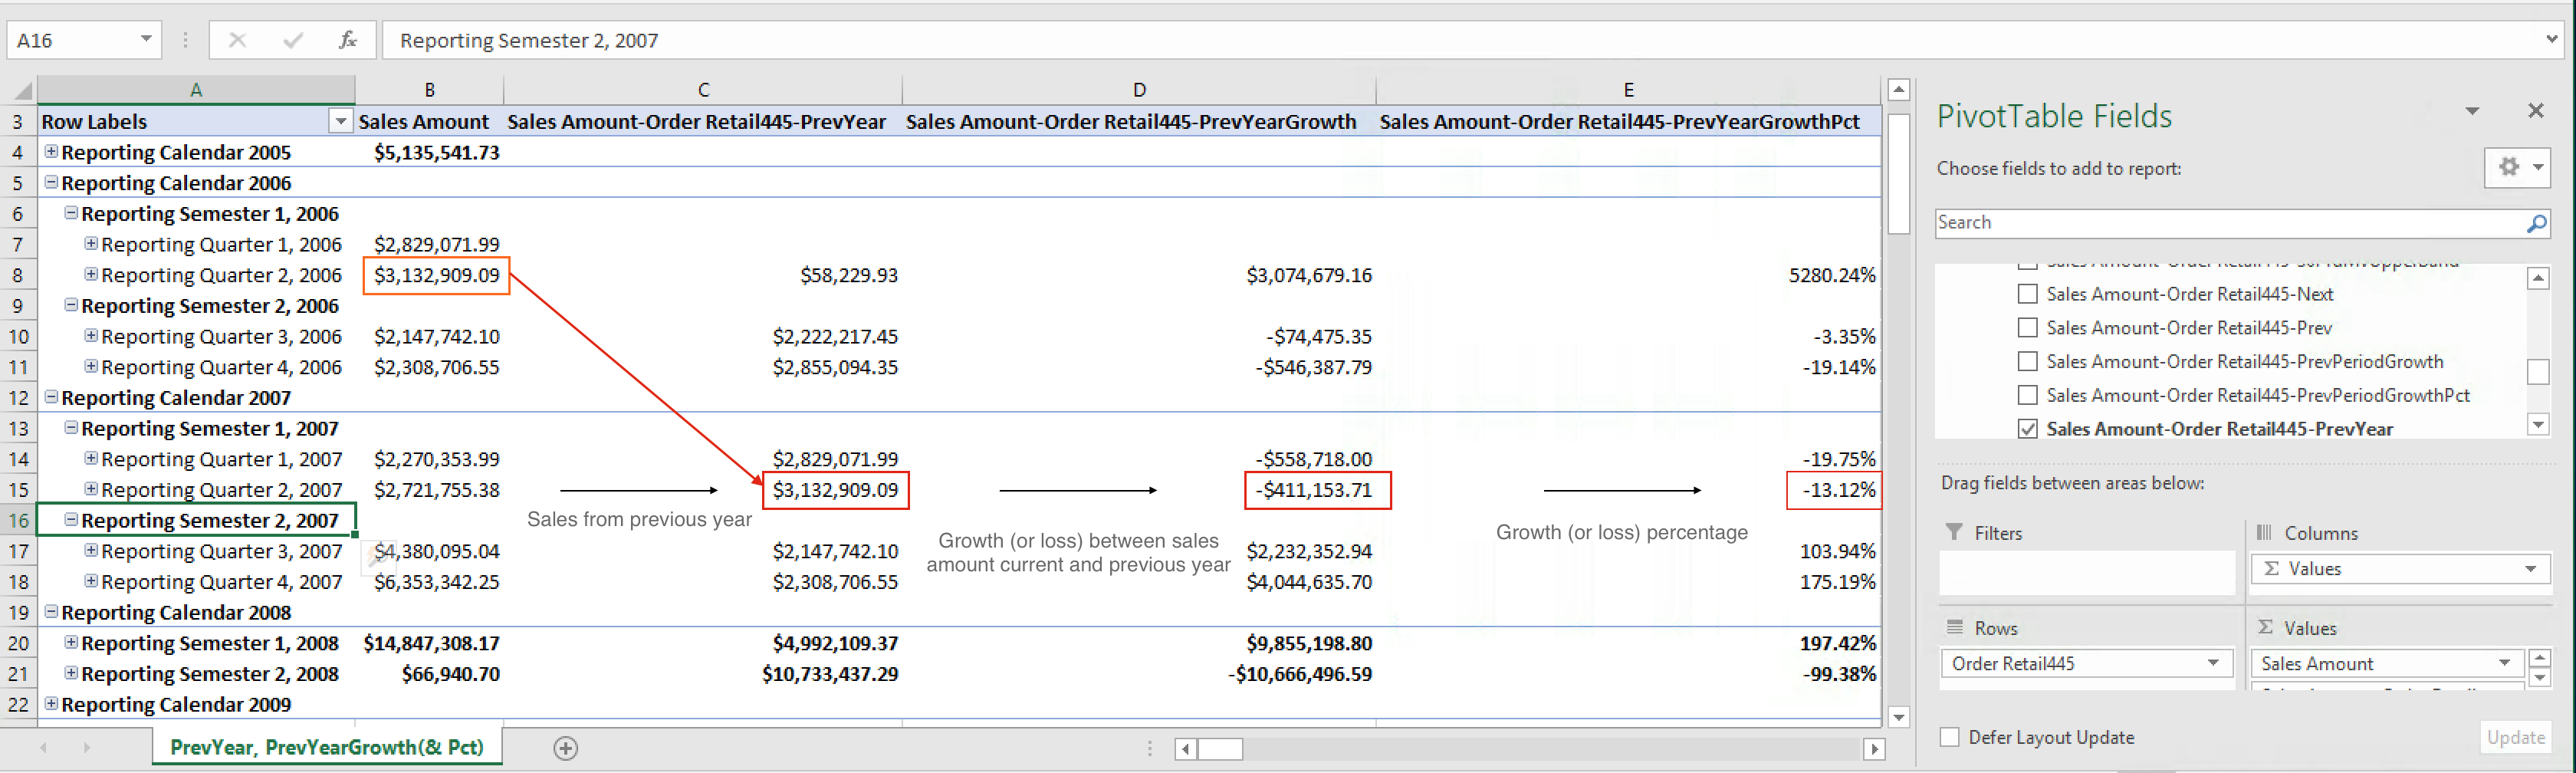
Figure 2. Excel workbook for use cases 1 and 2
Sales growth year-over-year
In this use case, the calculated measures below can be used to find the internet sales growth over one year (between now and the same time last year). The MDX expressions below use CURRENTMEMBER and PARALLELPERIOD.
-
-
Calculated measure for internet sales from last year:
[Measures].[Sales Amount-Order Retail445-PrevYear]
(ParallelPeriod(
   [Order Date Dimension].[Order Retail445].[Order Reporting_Year],
   1,
   [Order Date Dimension].[Order Retail445].CurrentMember),
   [Measures].[salesamount1]
) -
-
-
Calculated measure for growth of internet sales between last year and the current year:
[Measures].[Sales Amount-Order Retail445-PrevYearGrowth]
([Order Date Dimension].[Order Retail445].CurrentMember, [Measures].[salesamount1])
-
[Measures].[Sales Amount-Order Retail445-PrevYear] -
Figure 3. Tableau workbook for use cases 3 and 4
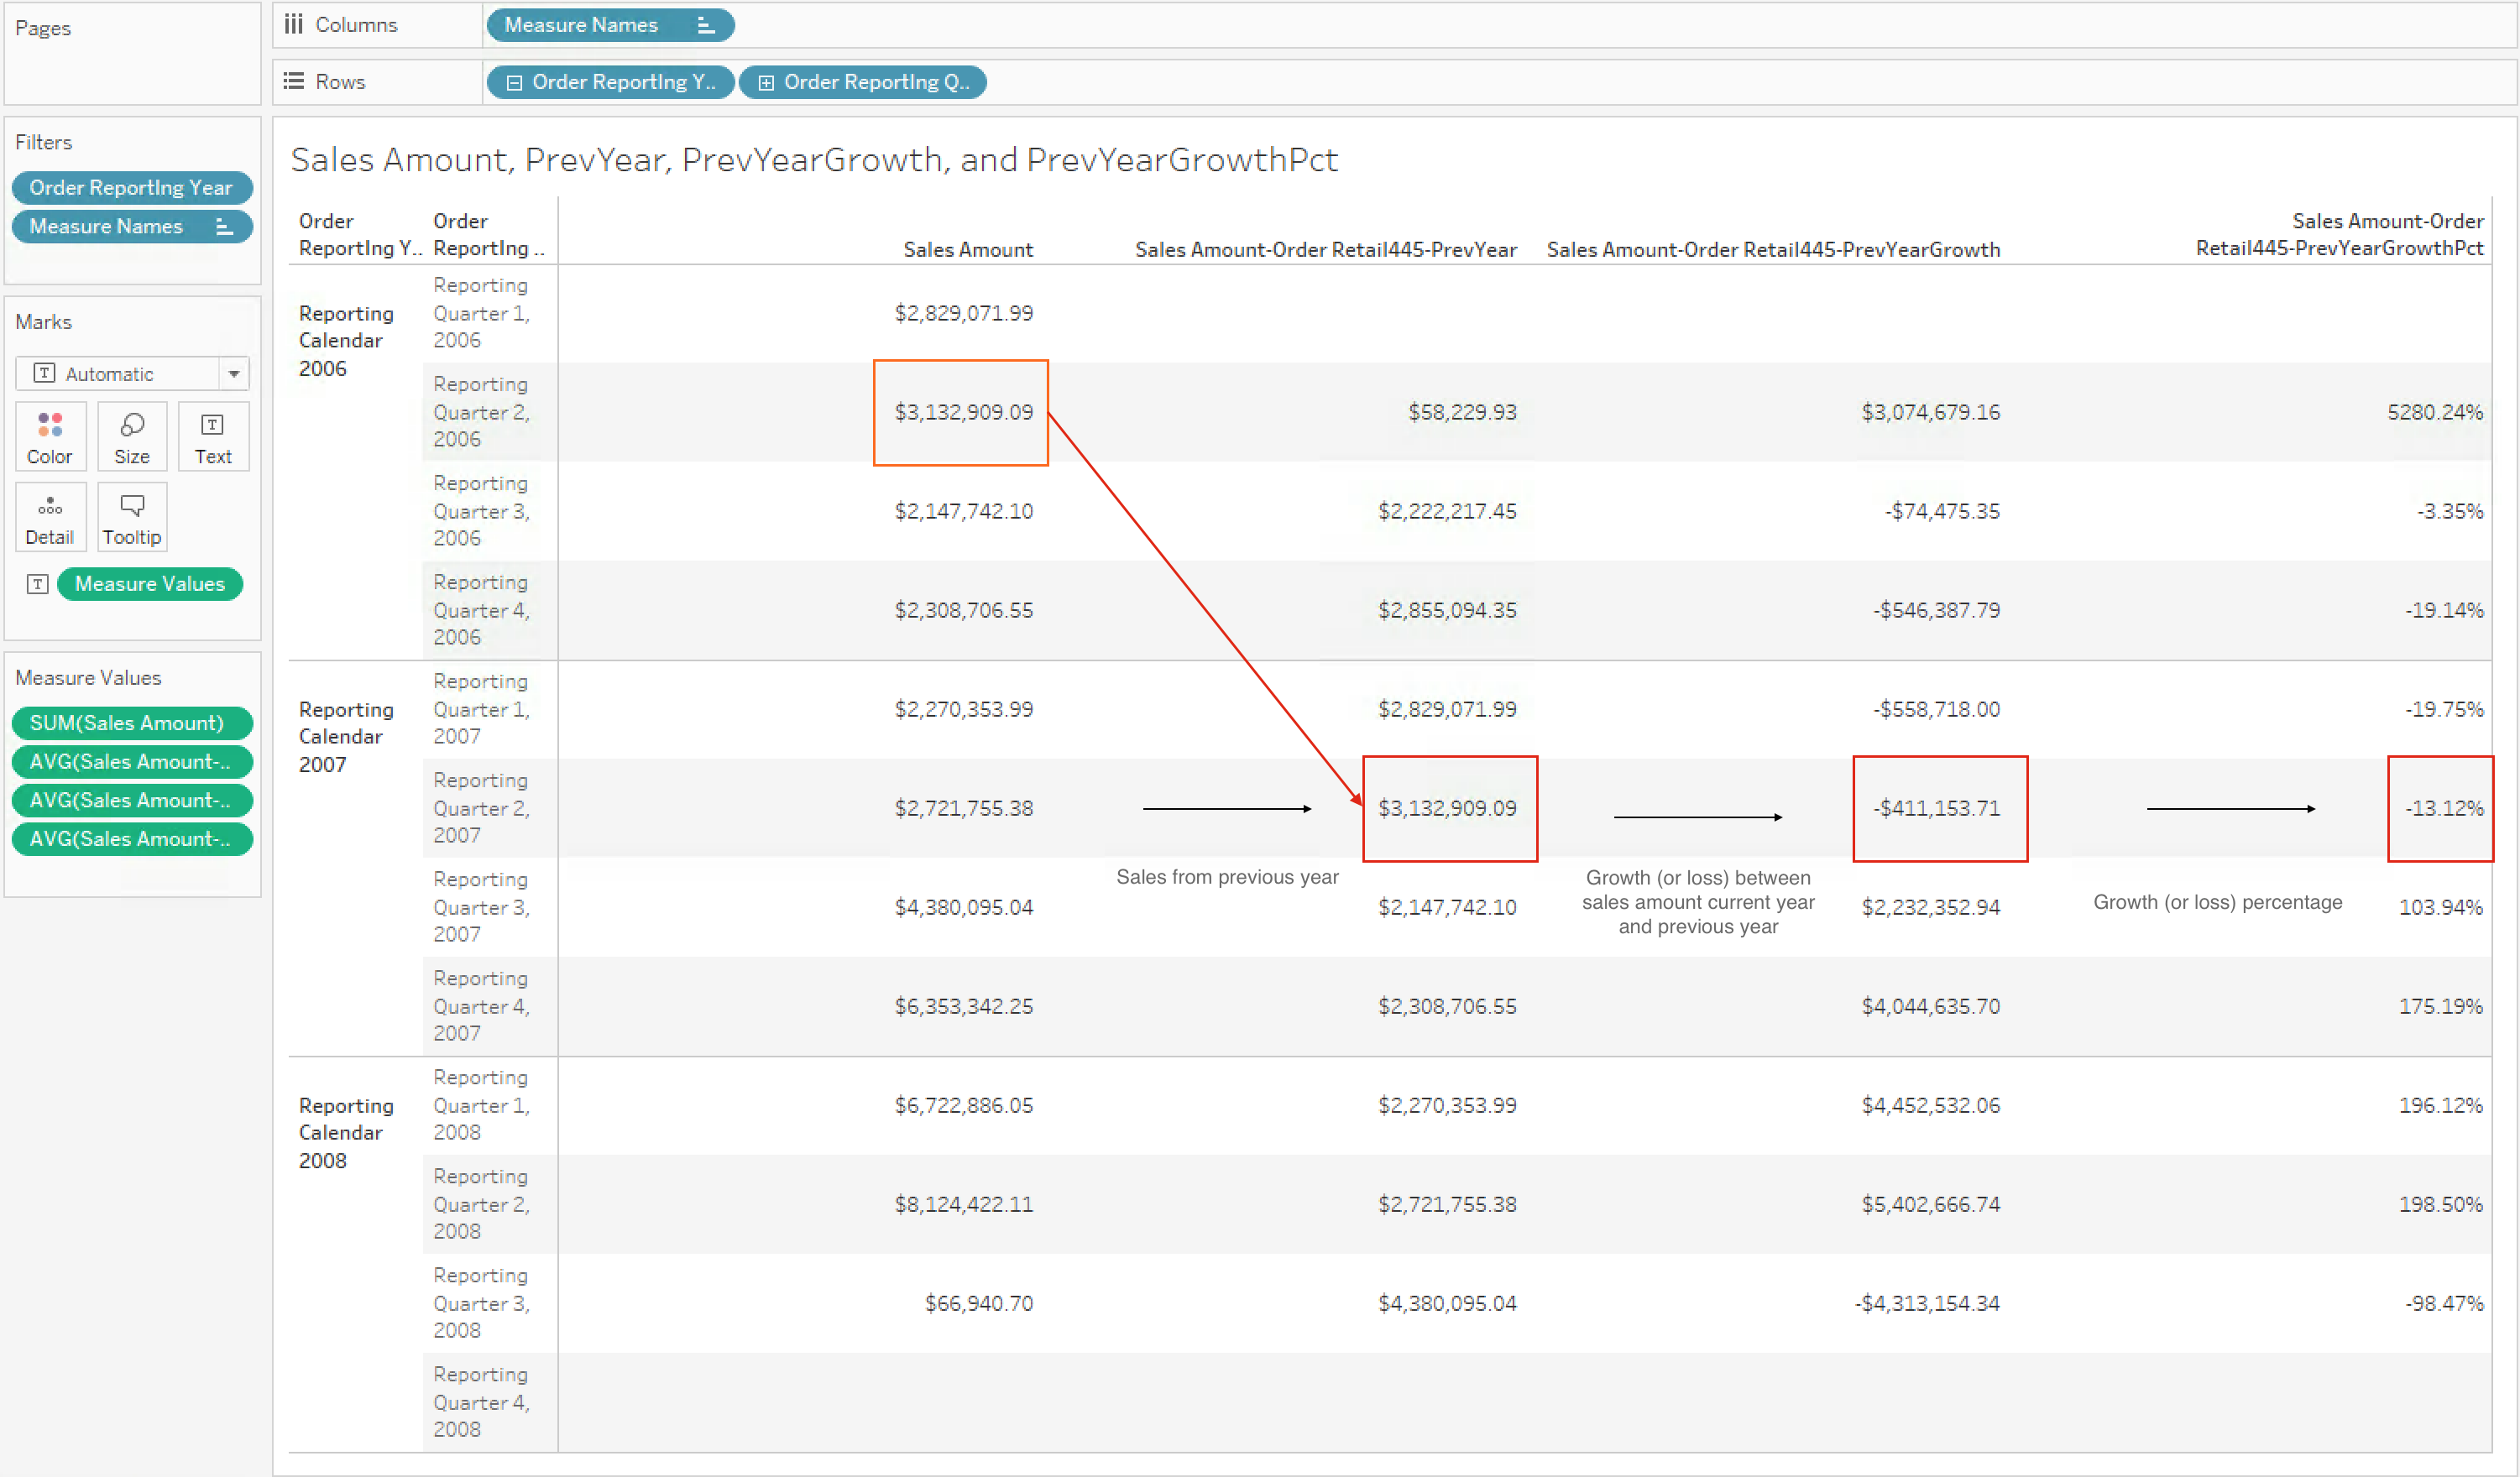
Figure 4. Excel workbook for use cases 3 and 4
Sales year-to-date
In this use case, the calculated measure below can be used to find the internet sales for the year, ending with the current date.
-
- Calculated measure for the aggregate of sales for the year:
[Measures].[Sales Amount-Order Retail445-YTD]
MDX expression:
Aggregate(
  PeriodsToDate(
      [Order Date Dimension].[Order Retail445].[Order Reporting_Year],
      [Order Date Dimension].[Order Retail445].CurrentMember
      ),
      [Measures].[salesamount1]
) - Calculated measure for the aggregate of sales for the year:
Sales year-to-date by day, compared to previous year
In this use case, the calculated measure below can be used to compare the daily sales amount for the year-to-date, and the year-to-date sales of the year previous.
-
- Calculated measure for all internet sales of the year previous to
the current year:
[Measures].[Sales Amount-Order Retail445-YTDPrevYear]
MDX expression:
Aggregate(
  PeriodsToDate(
      [Order Date Dimension].[Order Retail445].[Order Reporting_Year],
      ParallelPeriod(
          [Order Date Dimension].[Order Retail445].[Order Reporting_Year],
          1,
          [Order Date Dimension].[Order Retail445].CurrentMember
          )
      ),
  [Measures].[salesamount1]
) - Calculated measure for all internet sales of the year previous to
the current year:
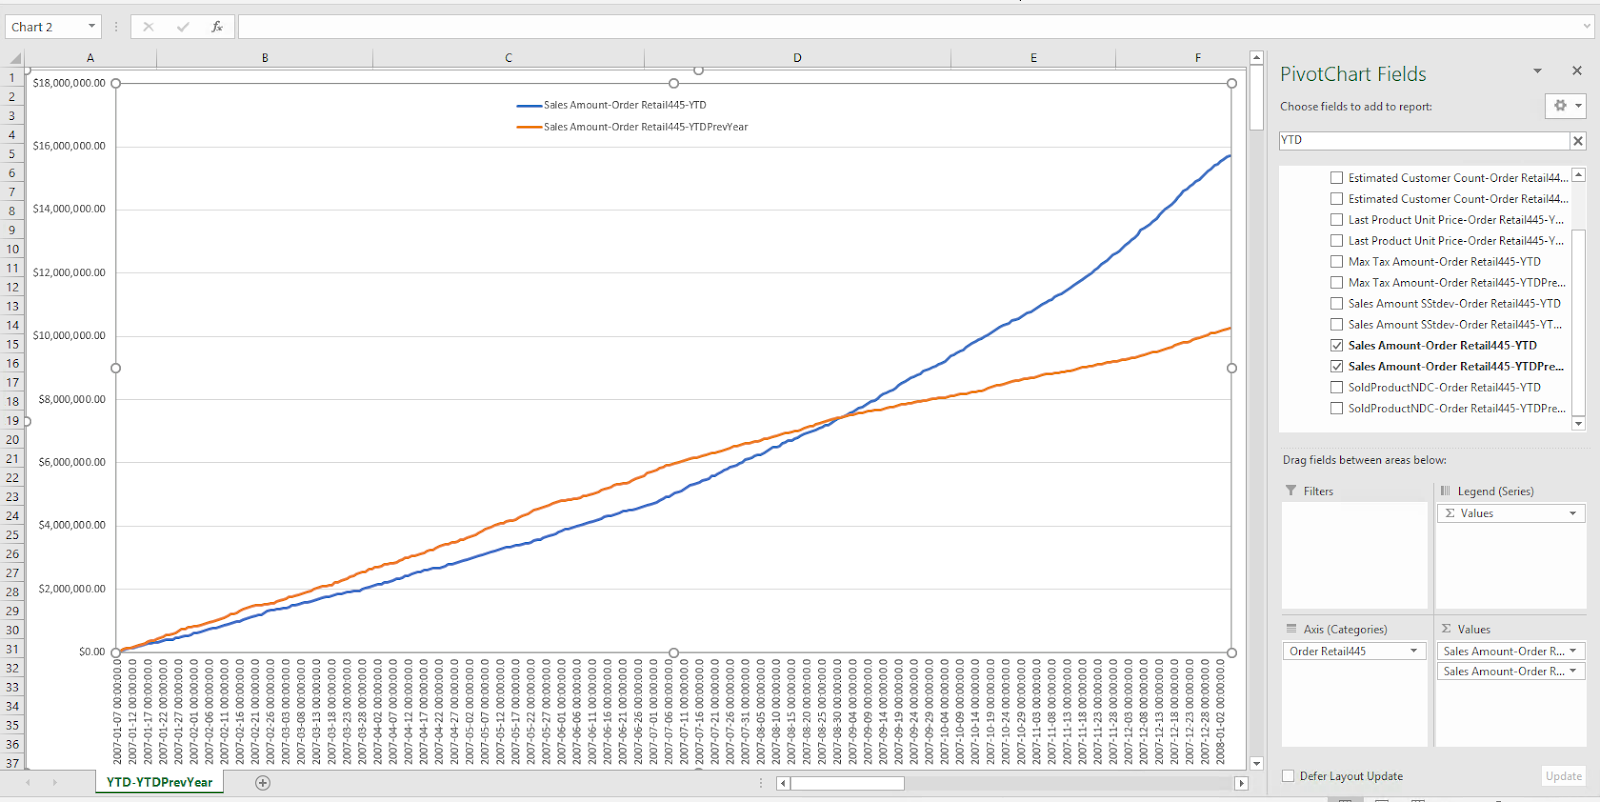
Figure 5. Tableau workbook for use cases 5 and 6
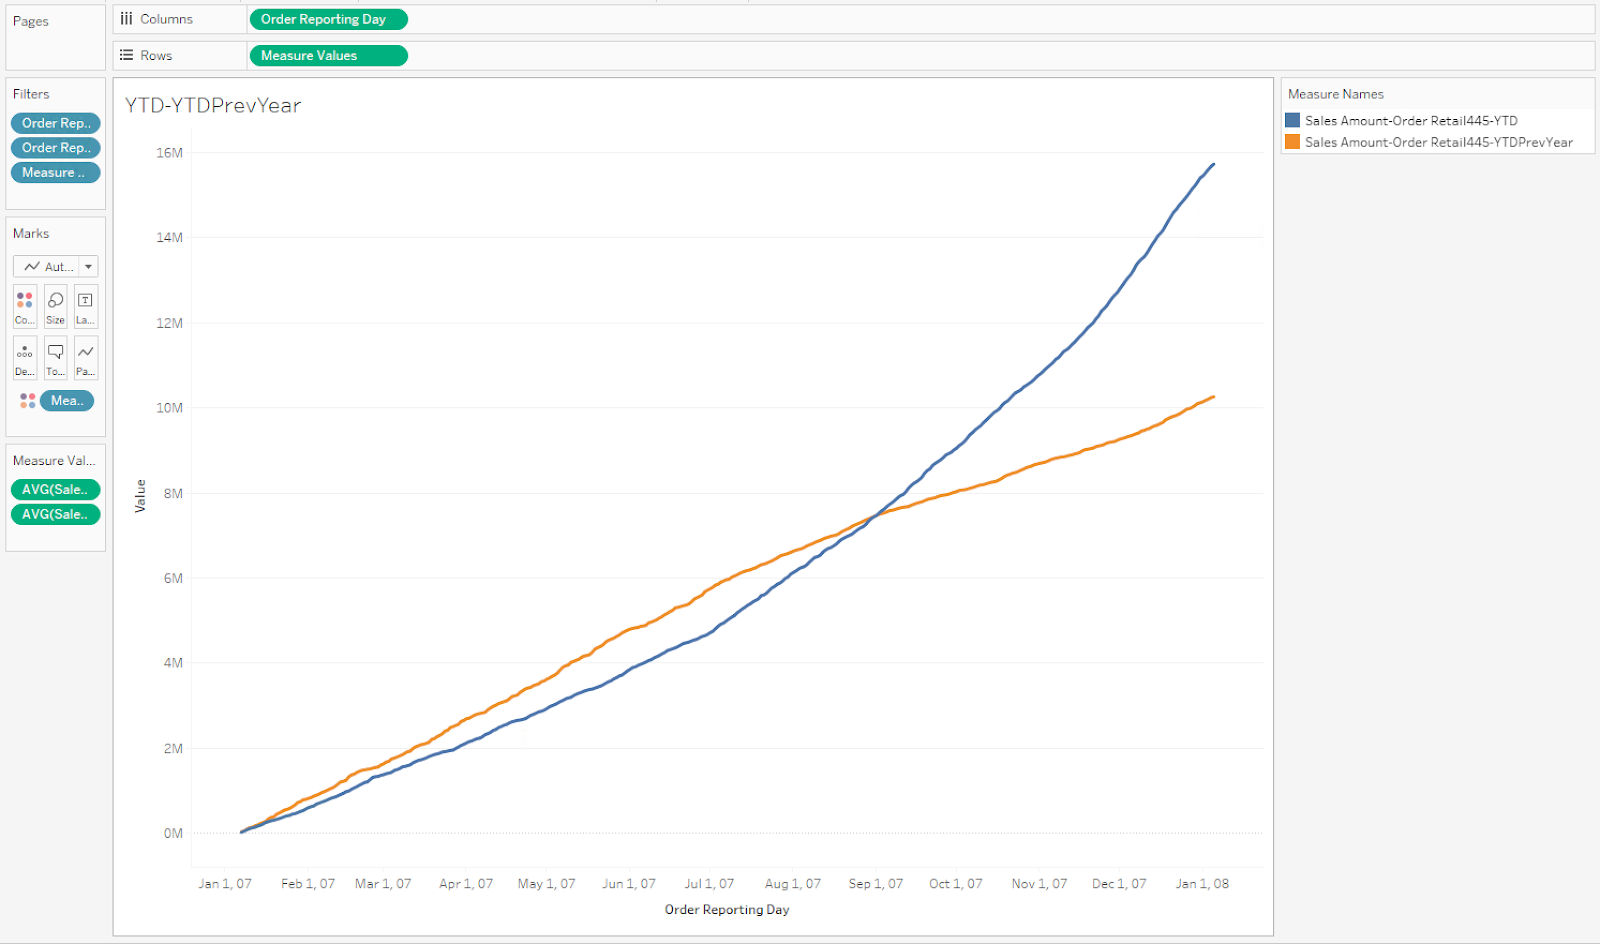
Figure 6. Excel workbook for use cases 5 and 6
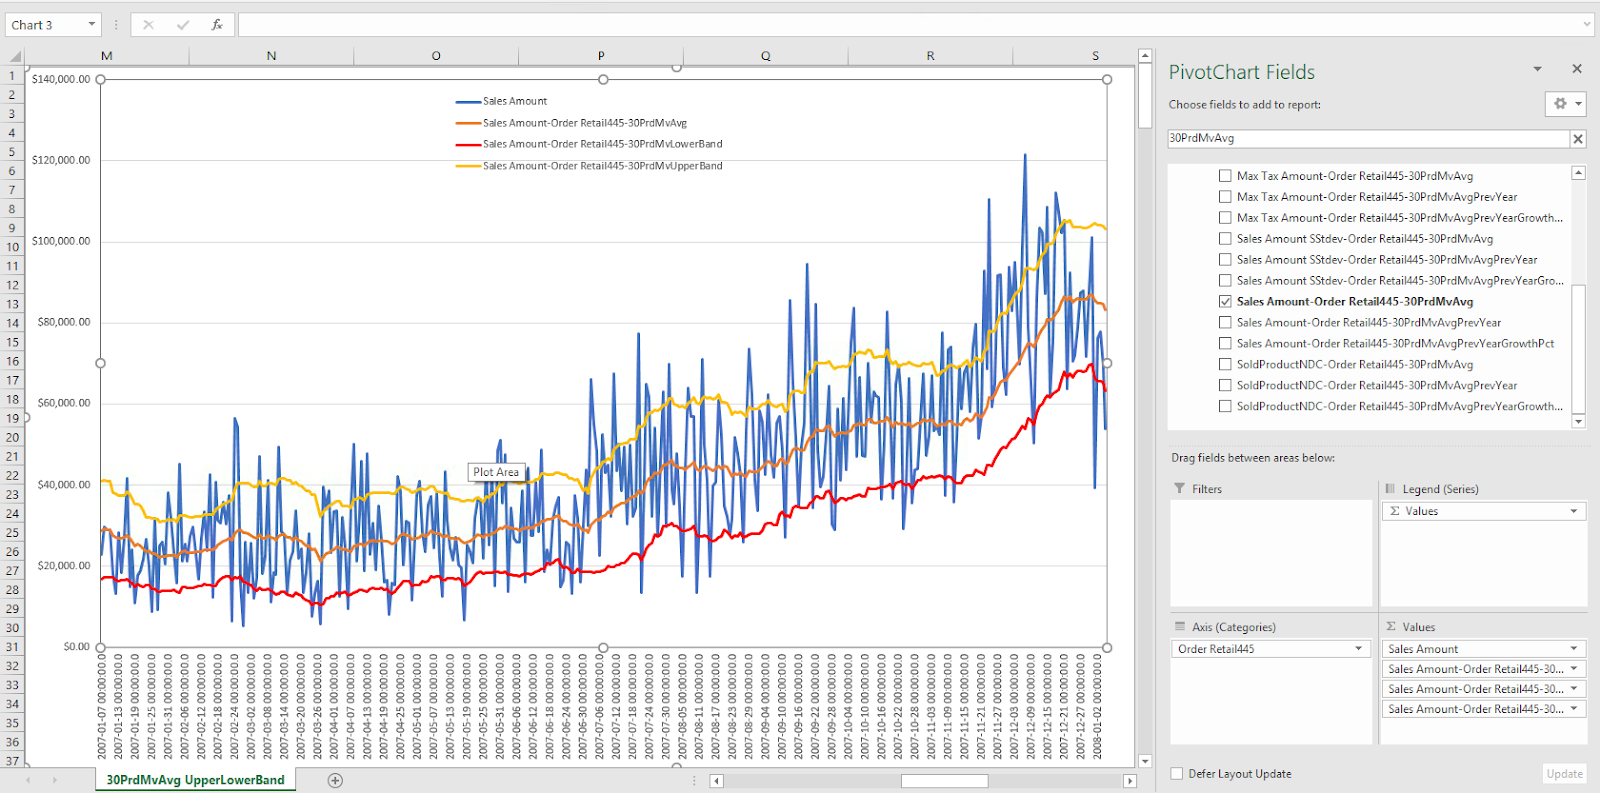
Daily sales compared to 30-period moving average and standard deviation
In this use case, the calculated measures can be used to compare each day's sales for the past 30 days, as well as each day's moving average of the previous 30 days. We can also find the upper and lower bounds of the daily moving average's standard deviation.
-
-
Calculated measure for the 30-period moving average:
[Measures].[Sales Amount-Order Retail445-30PrdMvAvg](Not that the Range operator ":" is inclusive at both ends of the range, so use a lag value of 29 to get a 30 period range.)
Avg(
  [Order Date Dimension].[Order Retail445].CurrentMember.Lag(29)
  :
  [Order Date Dimension].[Order Retail445].CurrentMember,
  [Measures].[salesamount1]
) -
-
-
Calculated measure for the 30-period moving average's standard deviation:
[Measures].[Sales Amount-Order Retail445-30PrdMvStdev]
Stdev(
  [Order Date Dimension].[Order Retail445].CurrentMember.Lag(29)
  :
  [Order Date Dimension].[Order Retail445].CurrentMember,
  [Measures].[salesamount1]
) -
-
-
Calculated measure for the standard deviation's upper bound:
[Measures].[Sales Amount-Order Retail445-30PrdMvUpperBand]
[Measures].[Sales Amount-Order Retail445-30PrdMvAvg]
+
[Measures].[Sales Amount-Order Retail445-30PrdMvStdev] -
-
-
Calculated measure for the standard deviation's lower bound:
[Measures].[Sales Amount-Order Retail445-30PrdMvLowerBand]
[Measures].[Sales Amount-Order Retail445-30PrdMvAvg]
-
[Measures].[Sales Amount-Order Retail445-30PrdMvStdev] -
Figure 7. Tableau workbook for use cases 7, 8, 9 and 10
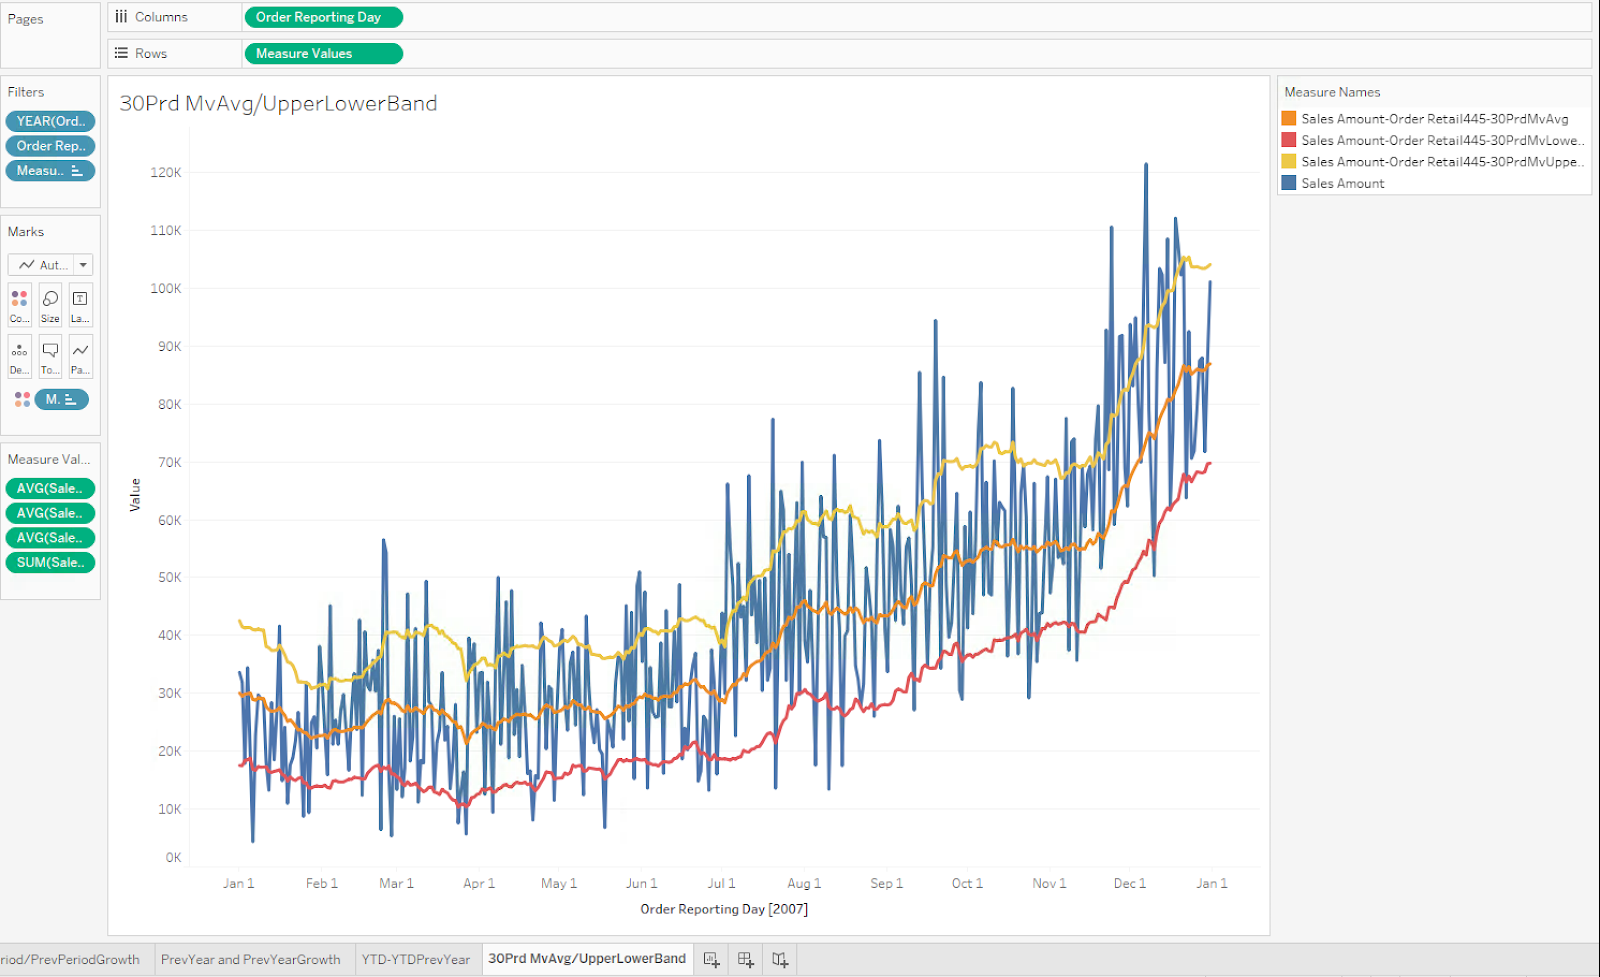
Figure 8. Excel visual representation for use cases 7, 8, 9 and 10
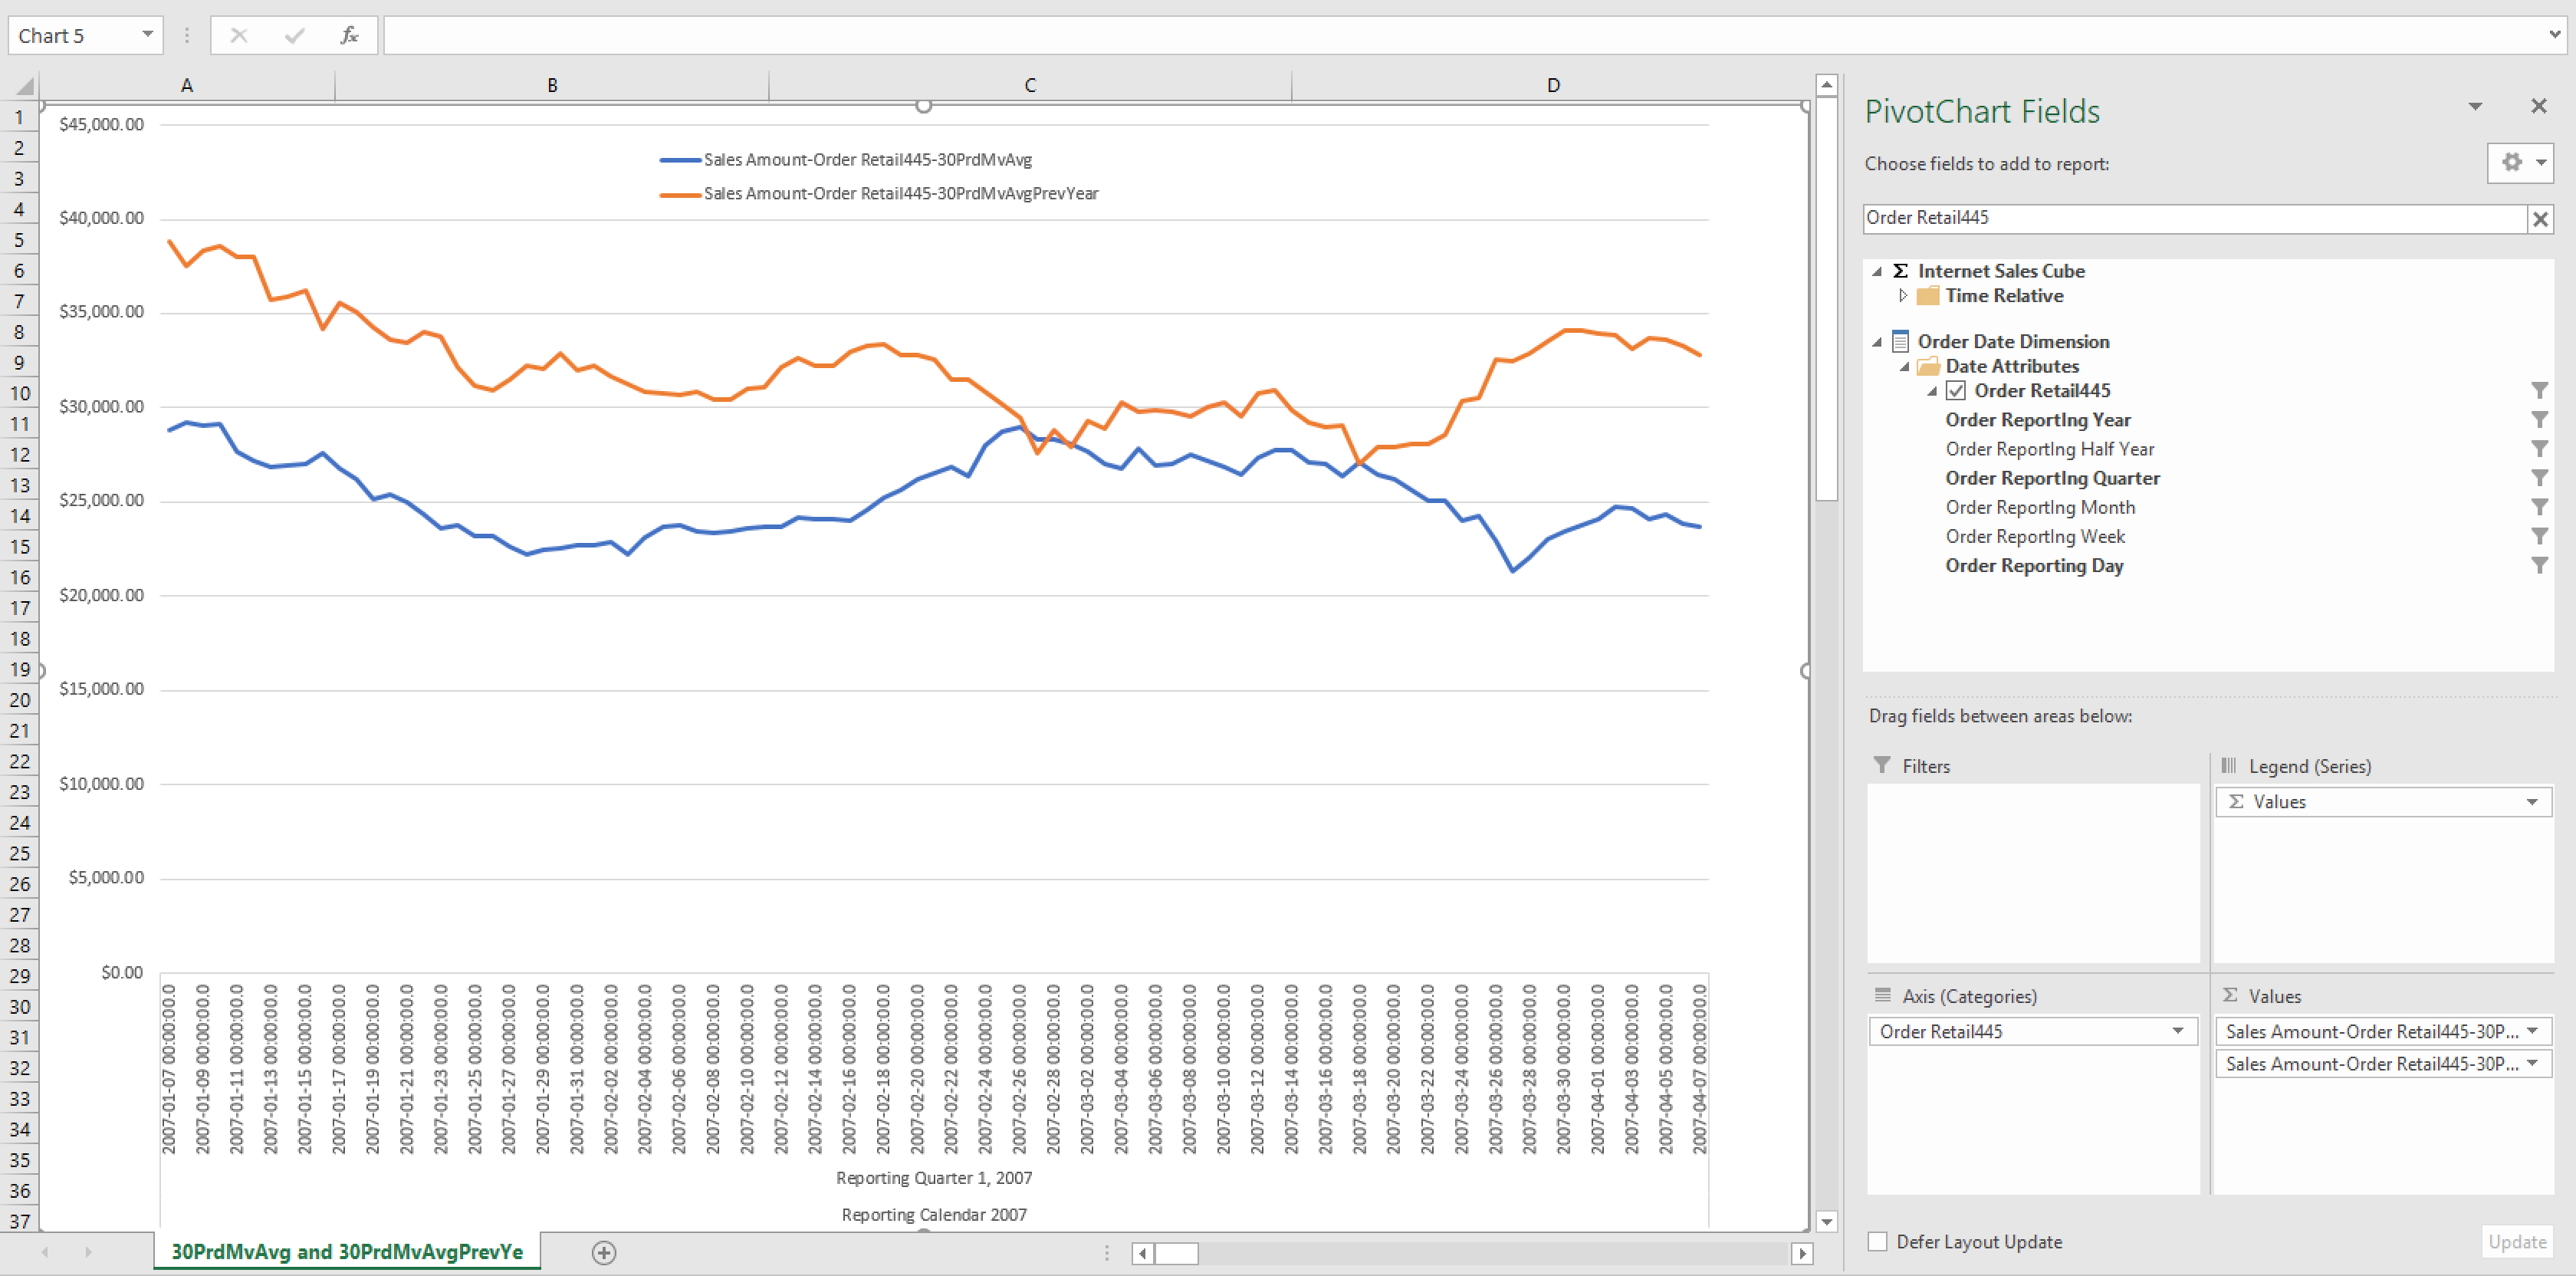
30-period moving average compared to the previous year's
This use case compares the moving average of sales for last 30 days, compared to the same period in the previous year.
-
-
Calculated measure for the 30-period moving average in the previous year:
[Measures].[Sales Amount-Order Retail445-30PrdMvAvgPrevYear]
Avg(
  ParallelPeriod(
      [Order Date Dimension].[Order Retail445].[Order ReportIng_Year],
      1,
      [Order Date Dimension].[Order Retail445].CurrentMember
      ).Lag(29):
  ParallelPeriod(
      [Order Date Dimension].[Order Retail445].[Order ReportIng_Year],
      1,
      [Order Date Dimension].[Order Retail445].CurrentMember
      ),
  [Measures].[salesamount1]
) -
Figure 9. Tableau workbook for use case 11 against 30PrdMvAvg
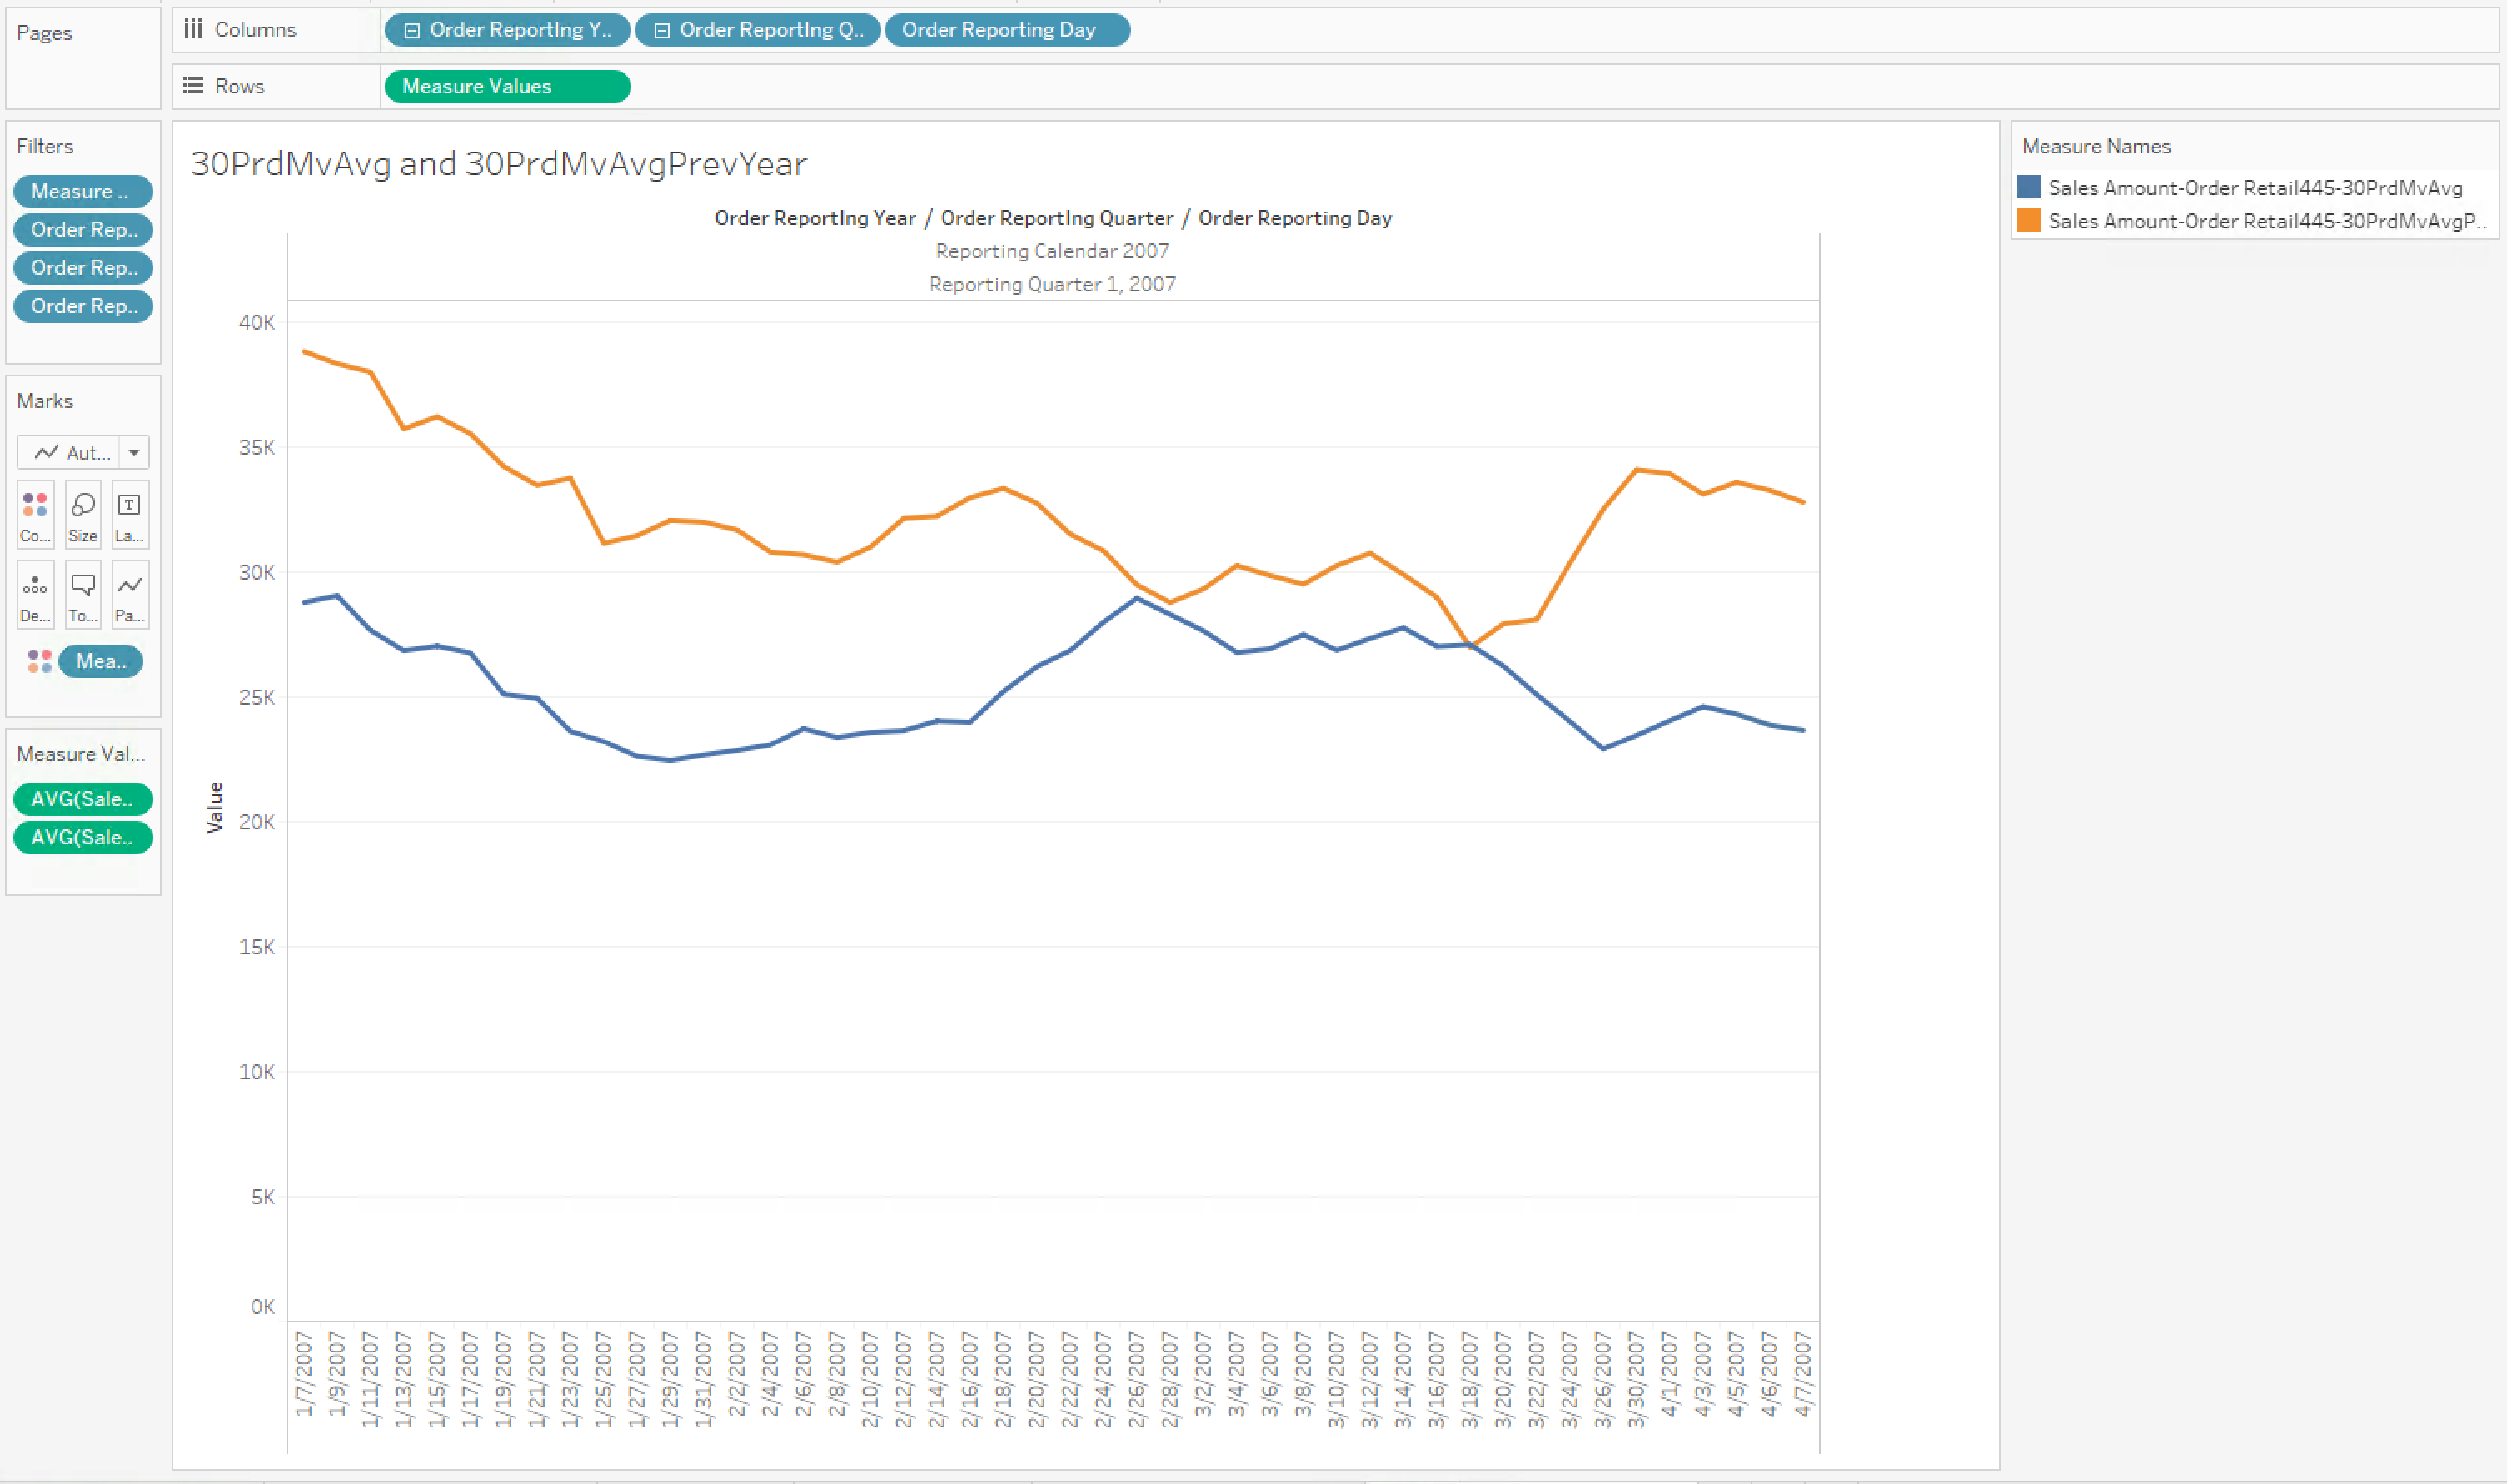
Figure 10. Excel workbook for use case 11 against 30PrdMvAvg
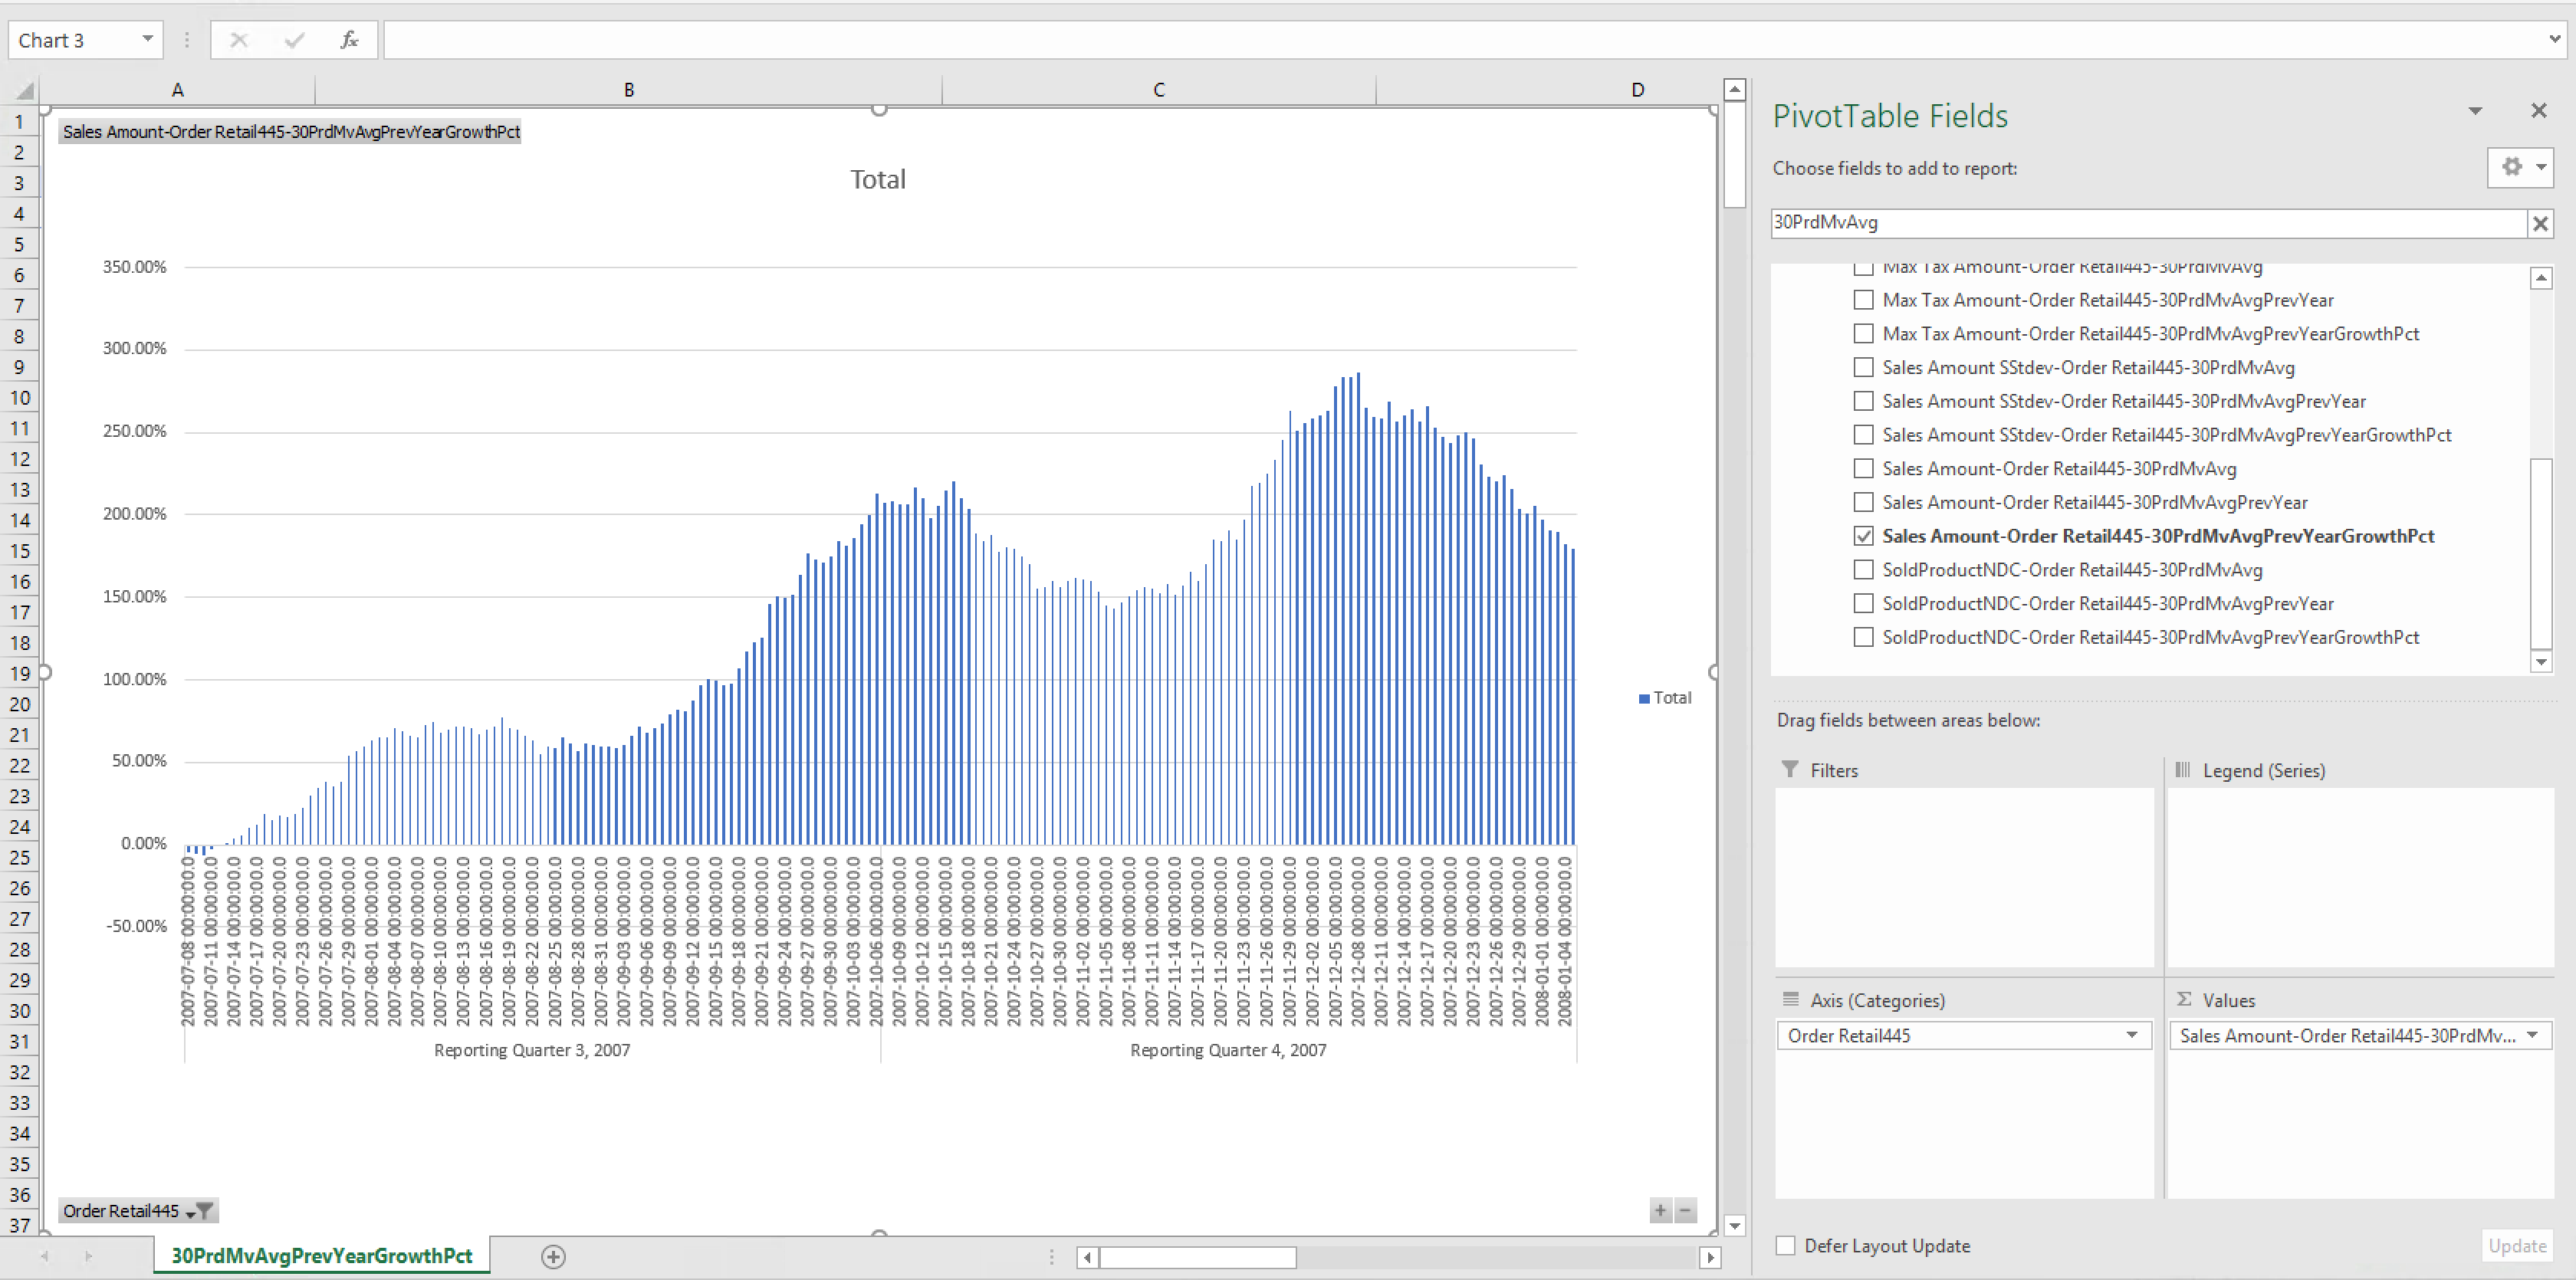
30-period moving average percent change compared to the previous year's
This use case compares the growth in percentage of the 30-period moving average, compared to that of the same period in the previous year.
-
-
Calculated measure for 30-period moving average growth between years :
[Measures].[Sales Amount-Order Retail445-30PrdMvAvgPrevYearGrowthPct]
(
    [Measures].[Sales Amount-Order Retail445-30PrdMvAvg]
    -
    [Measures].[Sales Amount-Order Retail445-30PrdMvAvgPrevYear]
    )
/
[Measures].[Sales Amount-Order Retail445-30PrdMvAvgPrevYear] -
Figure 11. Tableau workbook for use case 12
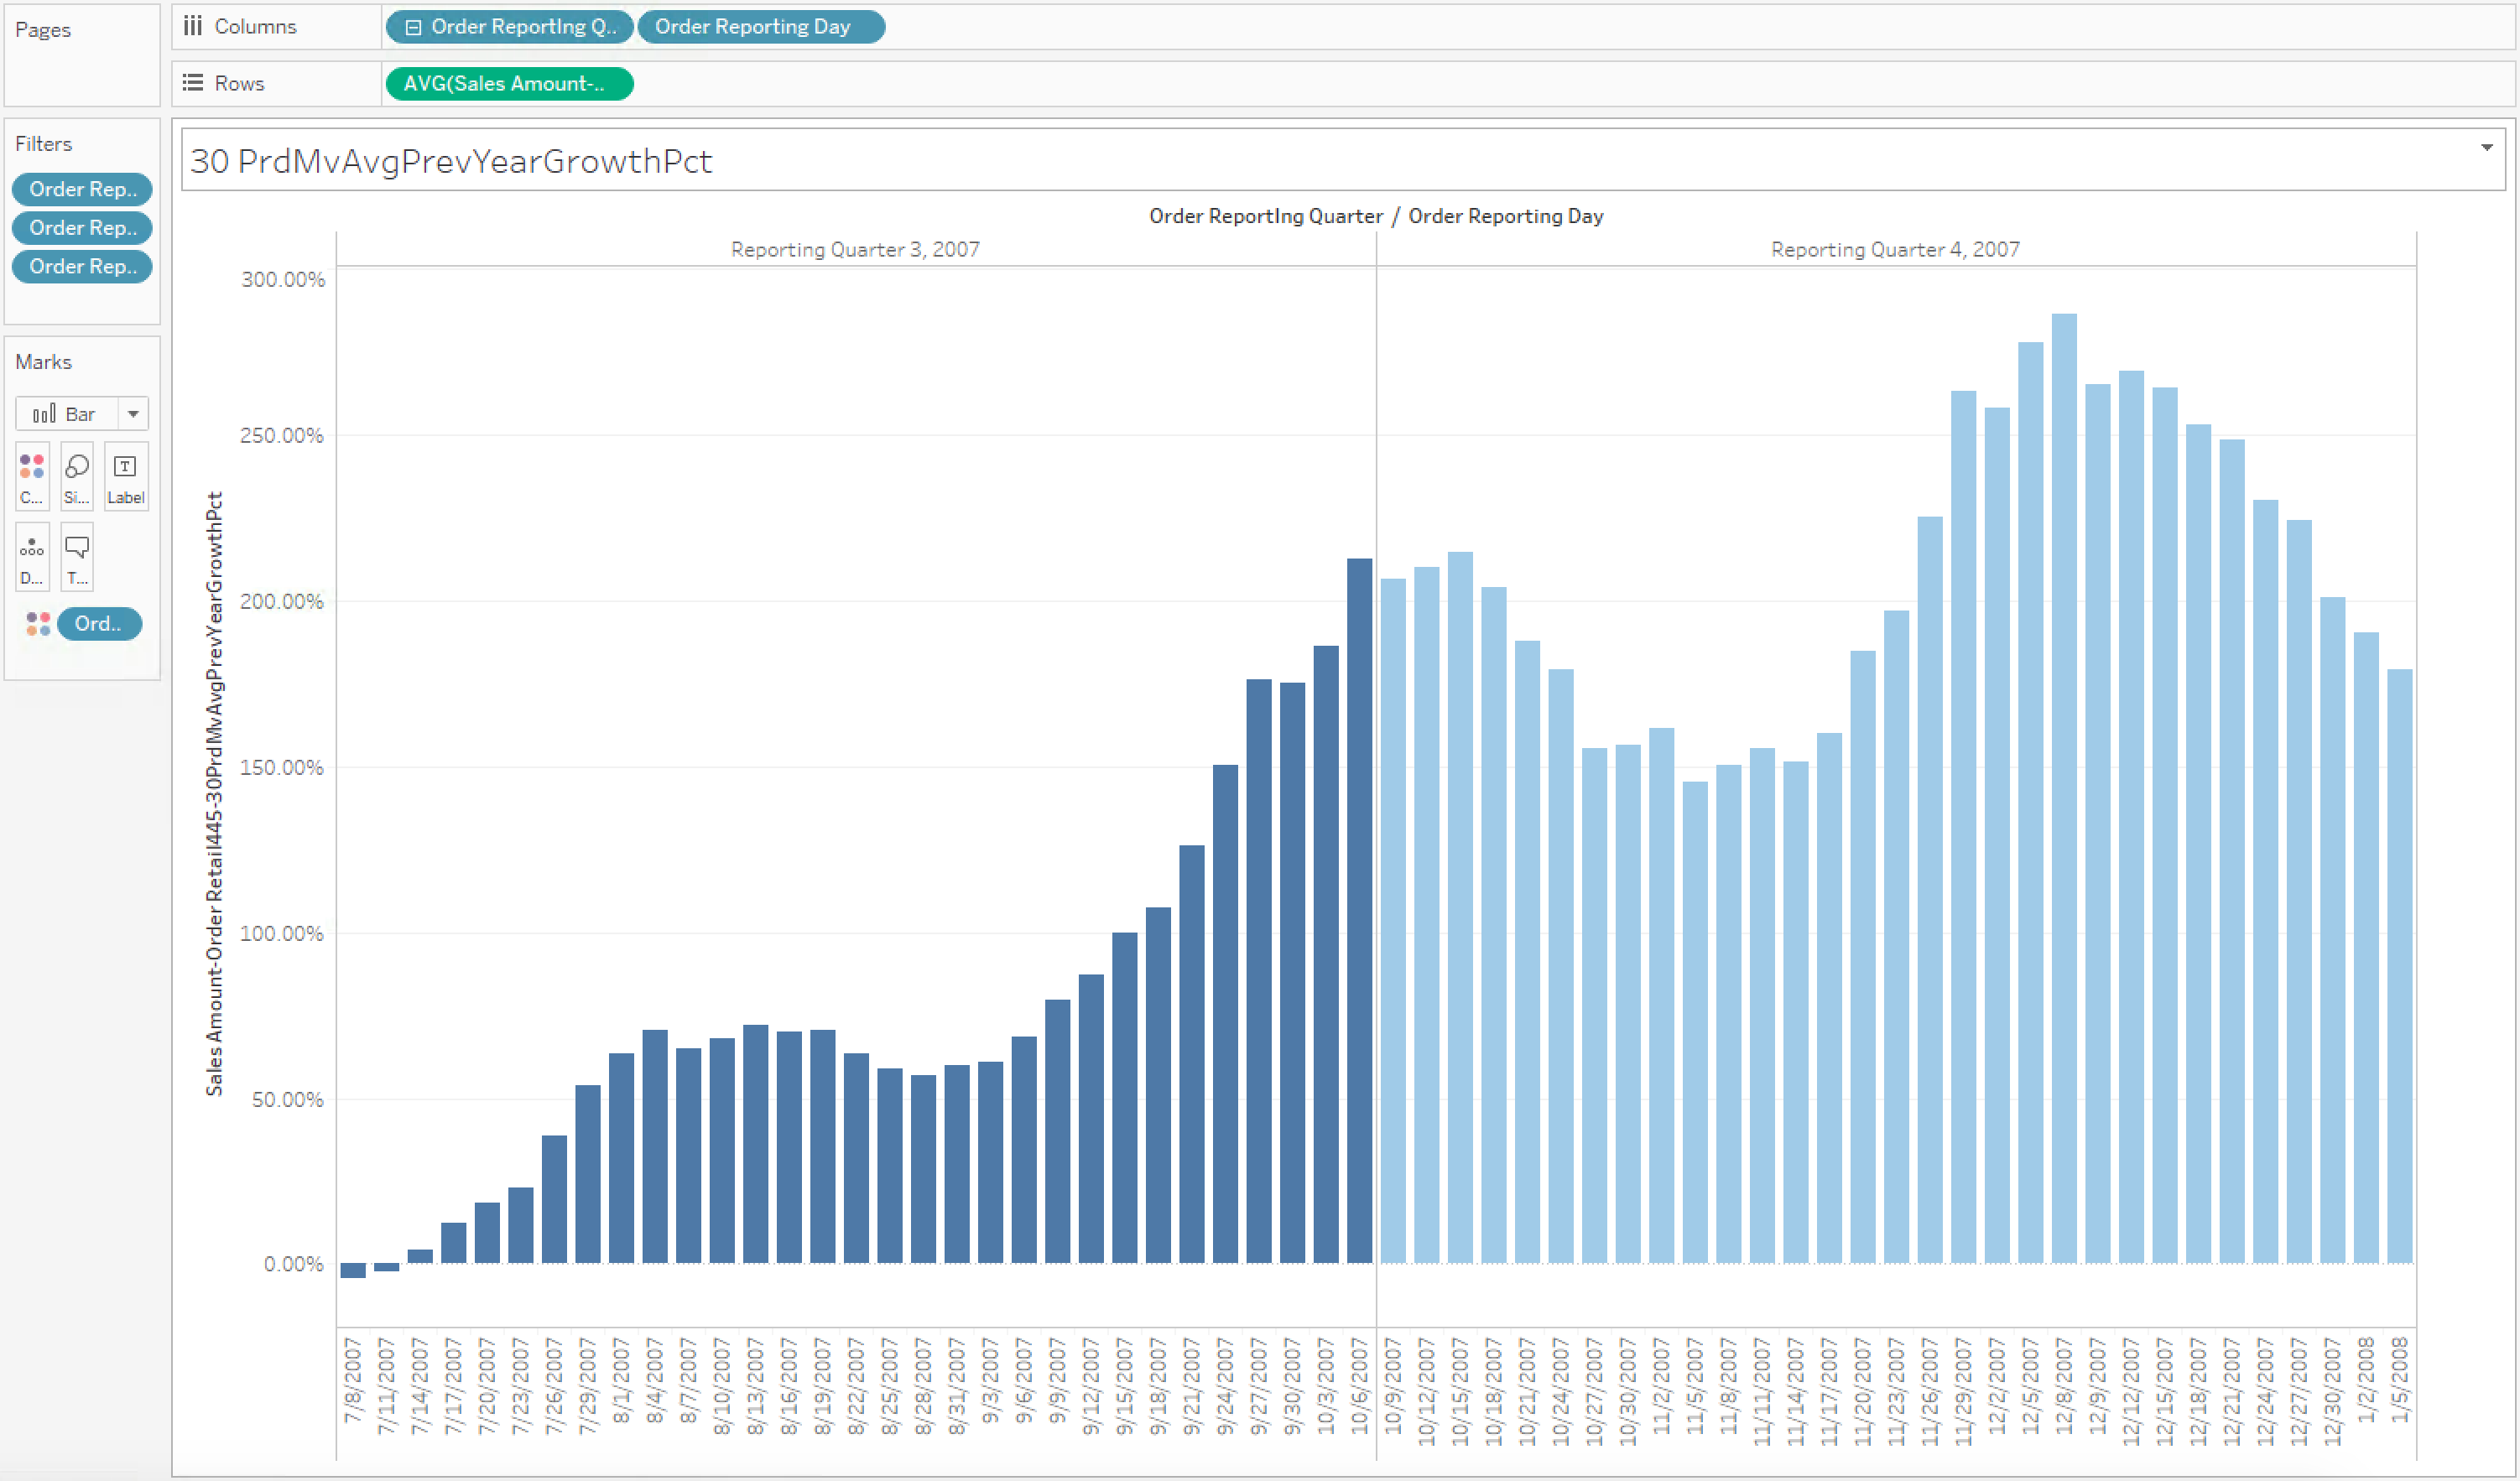
Figure 12. Excel workbook for use case 12