Excel Tips and Limitations
When building a PivotTable report in Excel using data in an AtScale cube, there are a few things you can do in Excel and/or AtScale to improve the experience. Additionally, there are some limitations when using AtScale with Microsoft Excel.
Tips
Filter Queries
It is strongly recommended that you set the
QUERY.FACTLESS.IGNOREINCIDENTALFILTER = FALSE engine setting and
restart the engine. Failure to do so will cause AtScale to return
unexpected results for filter queries.
Add Filters First
As a first step when building a PivotTable report, define and add the report filters first. This limits the scope of data up front, and less data means faster query results over all.
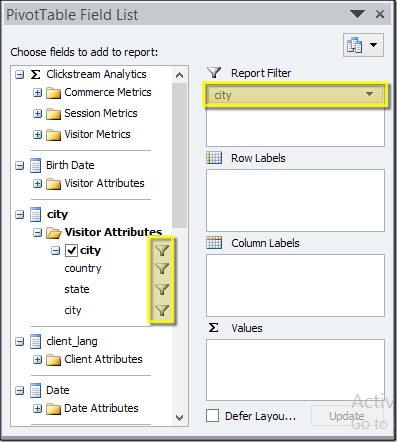
If you know how your data is partitioned in Hadoop, adding a filter on the corresponding partition field with improve query performance. For example, if your data is partitioned by month in Hadoop and you filter your report by the month attribute, then AtScale is able to eliminate the monthly partitions that do not meet the filter criteria without scanning the data. Less data to scan means faster query response times.
If you know the cube attributes (or fields) you plan to use as filters in your reports, you can also create AtScale aggregate tables ahead of time in AtScale Design Center. This will make adding filters more performant in general for first run queries.
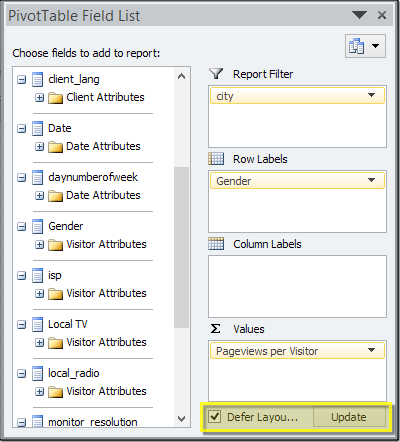
Excel does not allow you to have Defer Layout Update enabled when adding filters to your report. This means that Excel issues a query for each filter you add. Once you have your filters in place, you can then turn Defer Layout Update on.
Use the 'Defer Layout Update' Control
By default, each selection you make in your Excel PivotTable report issues a query to the data source. This can slow down report building.
After you have defined your report filters, enable the Defer Layout Update control. This allows you to make all of the selections for your report, and then click Update to issue just one query.
Enable Drill-Through Capability
To Access a Drill through set from Excel, click on Additional Actions > Default Drill Through option. Excel does not allow drill-through queries if you have fields in the Report Filter area of your report. This behavior is not specific to AtScale cubes - Microsoft SSAS cubes behave the same way. If you want to enable drill-through capability, move filter fields out of the Report Filter area and drill-through should work as expected.
By default, Excel issues a drill-through query that returns details for every measure and dimension attribute in the cube. This can not only be an expensive query, but also make the results hard to read. AtScale allows you to define drill-through column sets when you design a cube in AtScale Design Center to limit the results to only the details you want to see.
Filter dimensions by filtering on the values of measures
You can filter the values of dimension that are in pivot tables by the values of measures, whether those measure are in the pivot table or not.
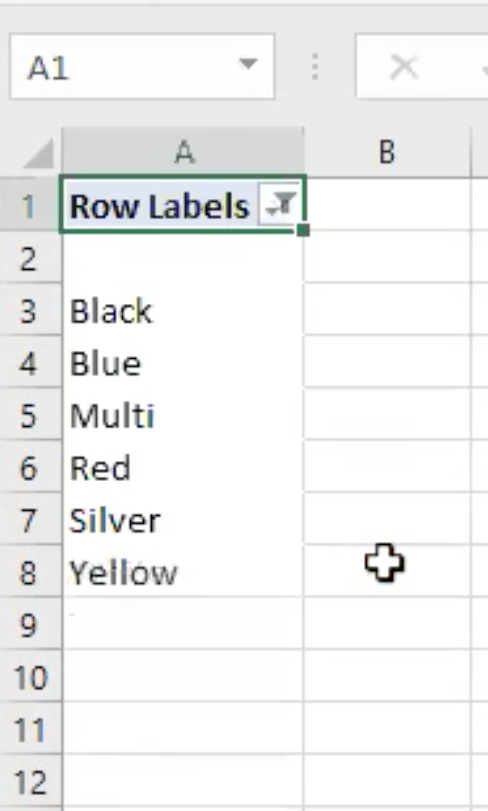
In this example, the Color dimension is in the pivot table.
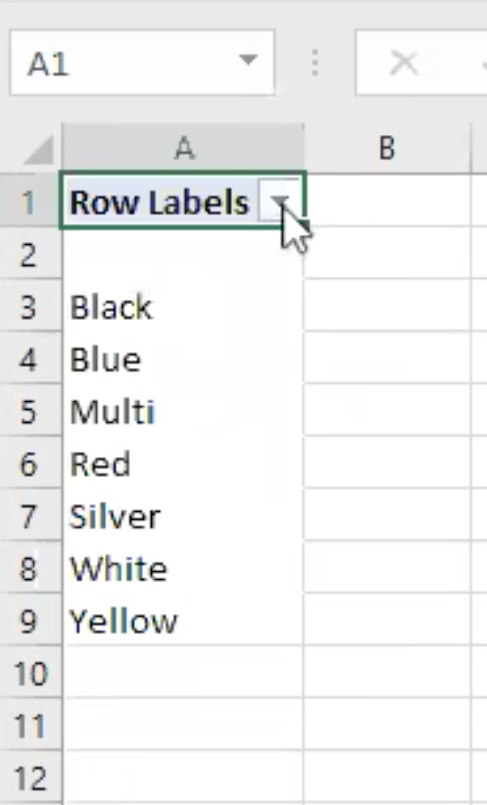
You can use a value filter on the dimension.
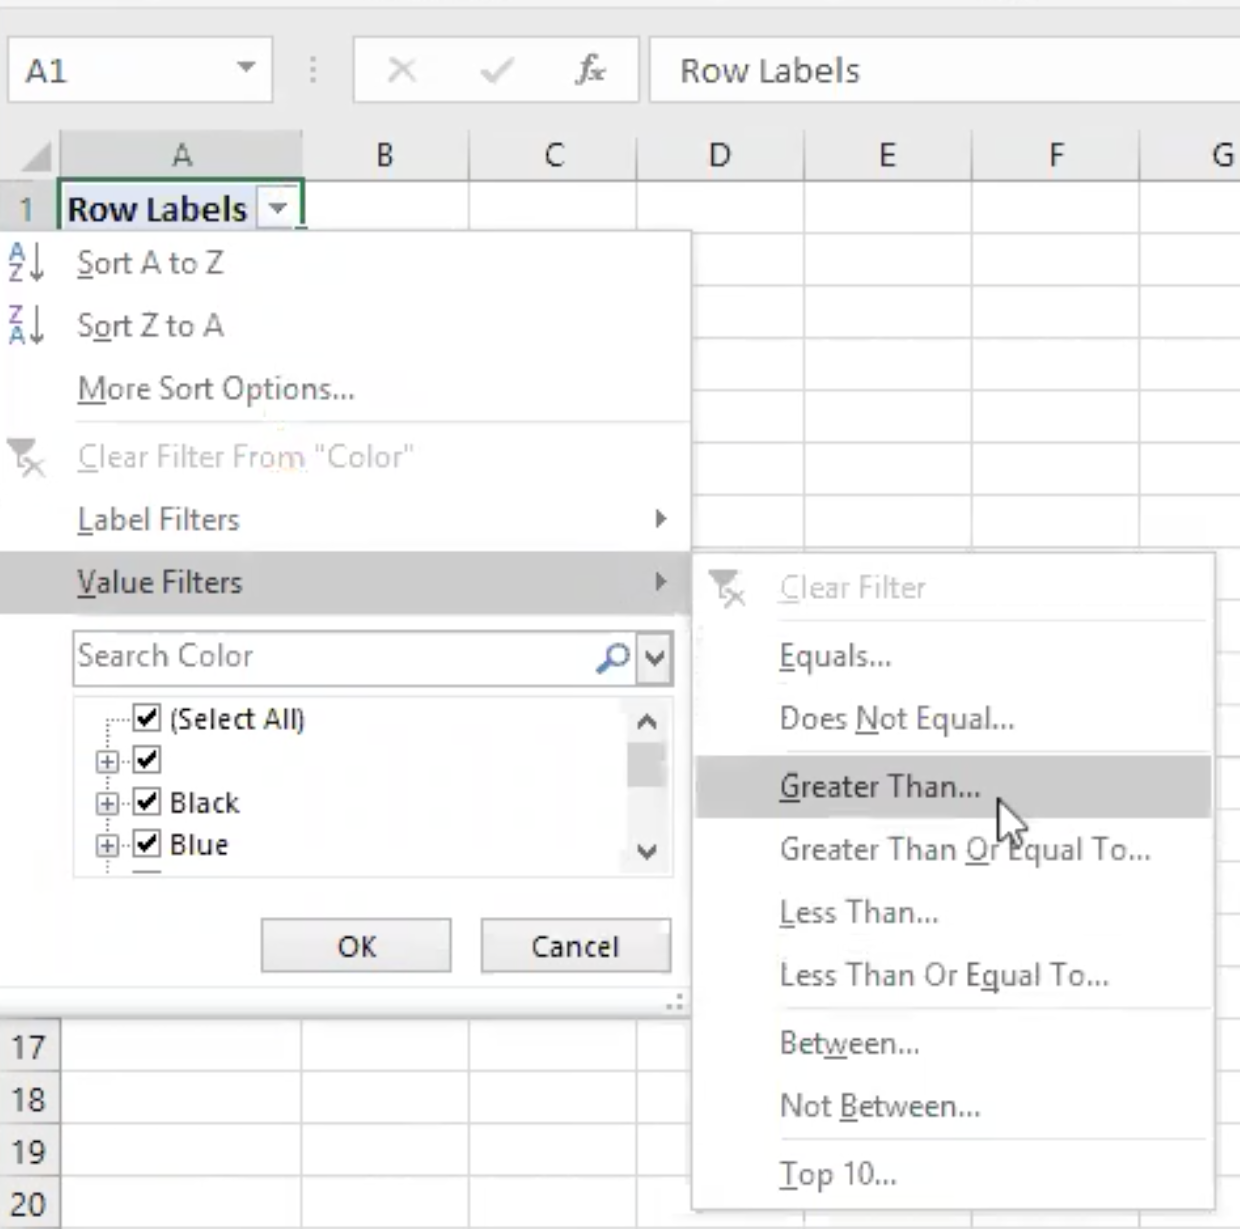
In this case, we show only the colors for which the value of Order Quantity is greater than 5,000.

The result is that White no longer appears in the list of dimension values.
Enable XMLA Metadata caching
You can improve the performance of some XMLA meta-data operations, such
as cube schema searching, at the risk of introducing BI tool caching. To
achieve this, enable the xmla.cube.lastdataupdate.enabled engine
setting (Off by default). If enabled, AtScale will update the
lastDataUpdate field periodically throughout the session rather than
on every request. You can set the period of refreshing using the
xmla.cube.lastDataUpdate.duration engine setting.
Enable XMLA Compression
When using XMLA-based BI tools (like Excel) with large projects (or under strained network conditions), you can improve communication with AtScale by enabling the Xpress compression. The average expected compression ratio is 75%, with an average compression time of 5 ms (and decompression time of 5 ms). To use this feature, enable the "soap.xpress.enabled" engine setting (Off by default).
Limitations
Group and Ungroup are not supported
The Group and Ungroup functionalities for pivot tables are not supported. Trying to use them could lead to error messages. (ATSCALE-14621)